كيفية ملء المساحات بين الأسطر في matplotlib
يمكنك بسهولة ملء المساحة بين القيم في مخطط Matplotlib باستخدام الوظائف التالية:
- fill_between() : يملأ المساحة الواقعة بين منحنيين أفقيين.
- fill_betweenx() : يملأ المساحة الواقعة بين منحنيين رأسيين.
يقدم هذا البرنامج التعليمي أمثلة حول كيفية استخدام كل من هذه الوظائف عمليًا.
مثال 1: املأ المساحة الواقعة بين خطين أفقيين
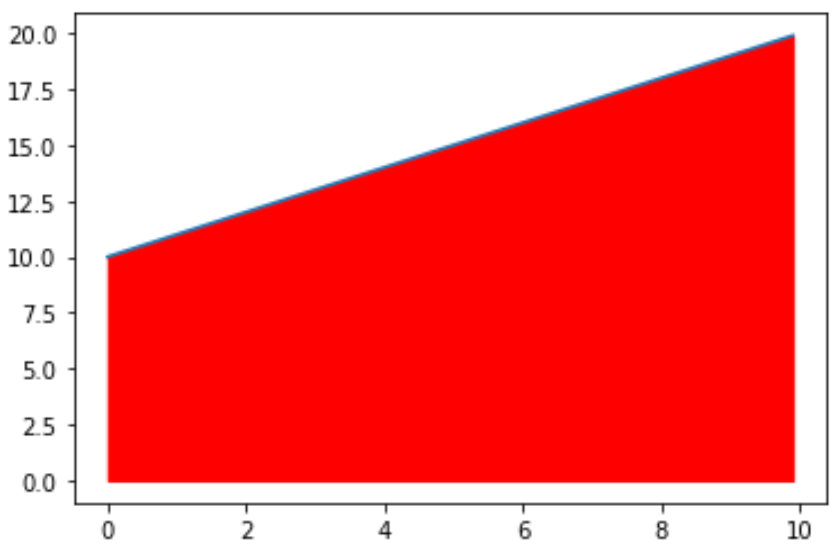
يوضح الكود التالي كيفية ملء المساحة بين خطين أفقيين:
 import matplotlib. pyplot as plt
import numpy as np

#define x and y values
x = np. arange (0,10,0.1)
y = np. arange (10,20,0.1)

#create plot of values
plt. plot (x,y)

#fill in area between the two lines
plt. fill_between (x,y,color=' red ')
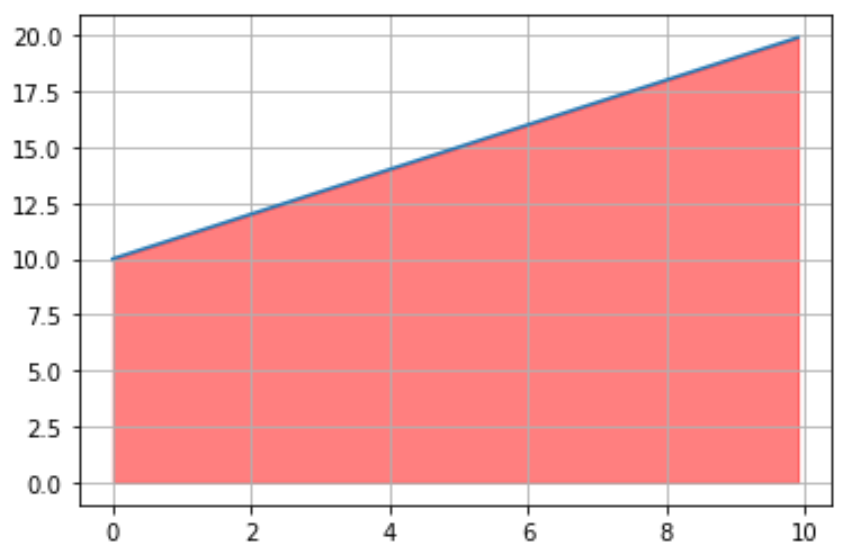
لاحظ أنه يمكننا أيضًا استخدام الدالة plt.grid() لإضافة شبكة إلى المخطط لمعرفة القيم المملوءة بسهولة أكبر:
 import matplotlib. pyplot as plt
import numpy as np

#define x and y values
x = np. arange (0,10,0.1)
y = np. arange (10,20,0.1)

#create plot of values
plt. plot (x,y)

#fill in area between the two lines
plt. fill_between (x, y, color=' red ', alpha= .5 )

#add gridlines
plt. grid ()
مثال 2: املأ المساحة الموجودة أسفل المنحنى
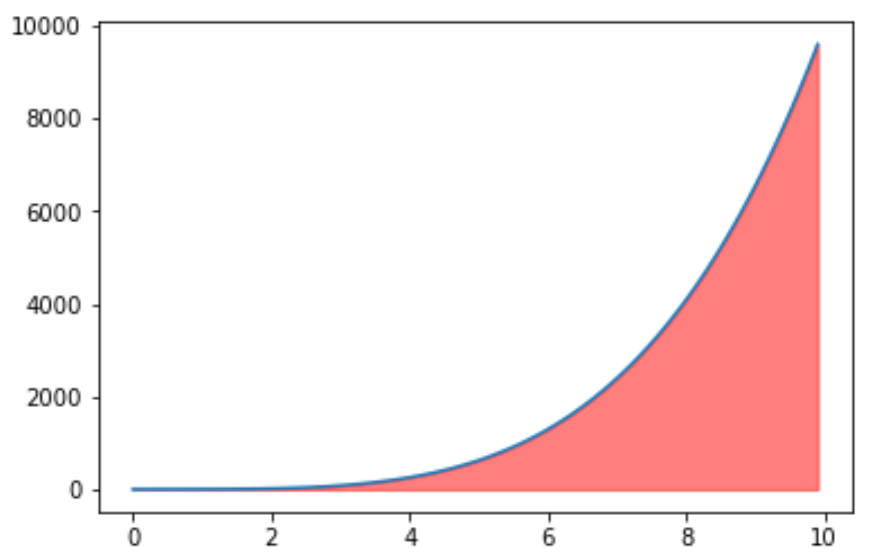
يوضح الكود التالي كيفية ملء المساحة الموجودة أسفل المنحنى:
 import matplotlib. pyplot as plt
import numpy as np

#define x and y values
x = np. arange (0,10,0.1)
y = x**4

#create plot of values
plt. plot (x,y)

#fill in area between the two lines
plt. fill_between (x, y, color=' red ', alpha= .5 )
مثال 3: املأ المساحة أعلى المنحنى
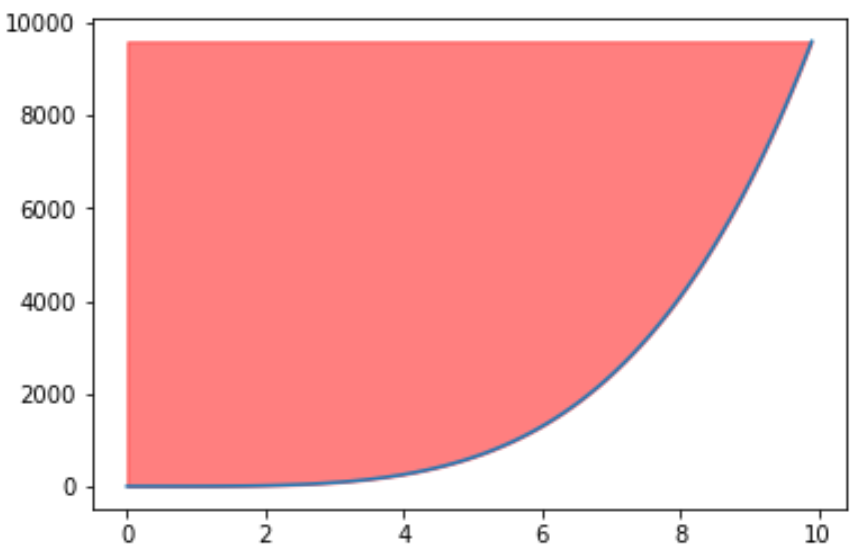
يوضح الكود التالي كيفية ملء المساحة أعلى المنحنى:
 import matplotlib. pyplot as plt
import numpy as np

#define x and y values
x = np. arange (0,10,0.1)
y = x**4

#create plot of values
plt. plot (x,y)

#fill in area between the two lines
plt. fill_between (x, y, np. max (y), color=' red ', alpha= .5 )
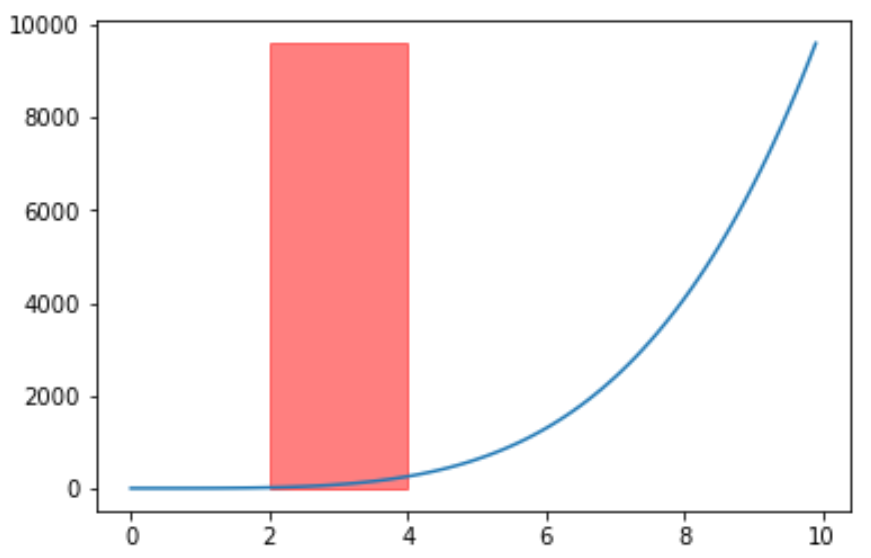
مثال 4: املأ المساحة الواقعة بين خطين رأسيين
يوضح التعليمة البرمجية التالية كيفية استخدام الدالة fill_betweenx() لملء المساحة بين خطين عموديين:
 import matplotlib. pyplot as plt
import numpy as np

#define x and y values
x = np. arange (0,10,0.1)
y = np. arange (10,20,0.1)

#create plot of values
plt. plot (x,y)

#fill in area between the two lines
plt. fill_betweenx (y, 2, 4, color=' red ', alpha= .5 )
ذات صلة: كيفية رسم منحنى سلس في Matplotlib