كيفية إنشاء منحنى الجرس في بايثون
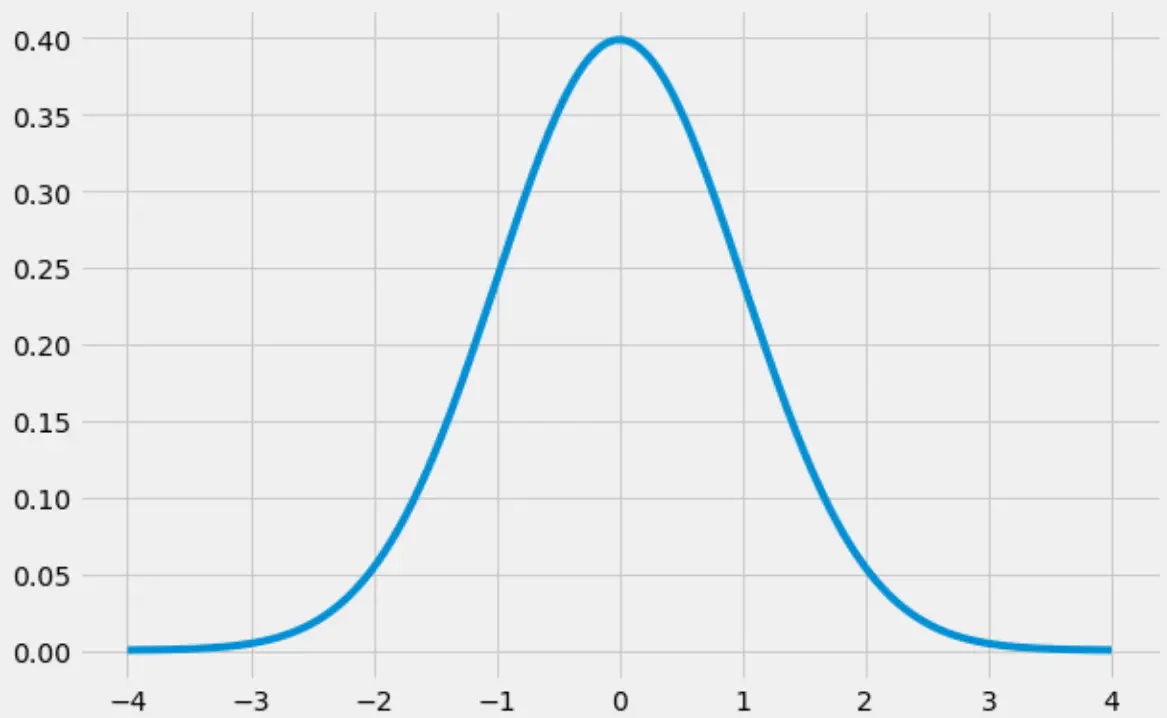
“منحنى الجرس” هو اللقب الذي يطلق على شكل التوزيع الطبيعي ، والذي له شكل “جرس” مميز:

يشرح هذا البرنامج التعليمي كيفية إنشاء منحنى الجرس في بايثون.
كيفية إنشاء منحنى الجرس في بايثون
يوضح الكود التالي كيفية إنشاء منحنى الجرس باستخدام مكتبات numpy و scipy و matplotlib :
 import numpy as np
import matplotlib.pyplot as plt
from scipy.stats import norm

#create range of x-values from -4 to 4 in increments of .001
x = np.arange(-4, 4, 0.001)

#create range of y-values that correspond to normal pdf with mean=0 and sd=1
y = norm.pdf(x,0,1)

#defineplot
fig, ax = plt.subplots(figsize=(9,6))
ax.plot(x,y)

#choose plot style and display the bell curve
plt.style.use('fivethirtyeight')
plt.show()

كيفية ملء منحنى الجرس في بايثون
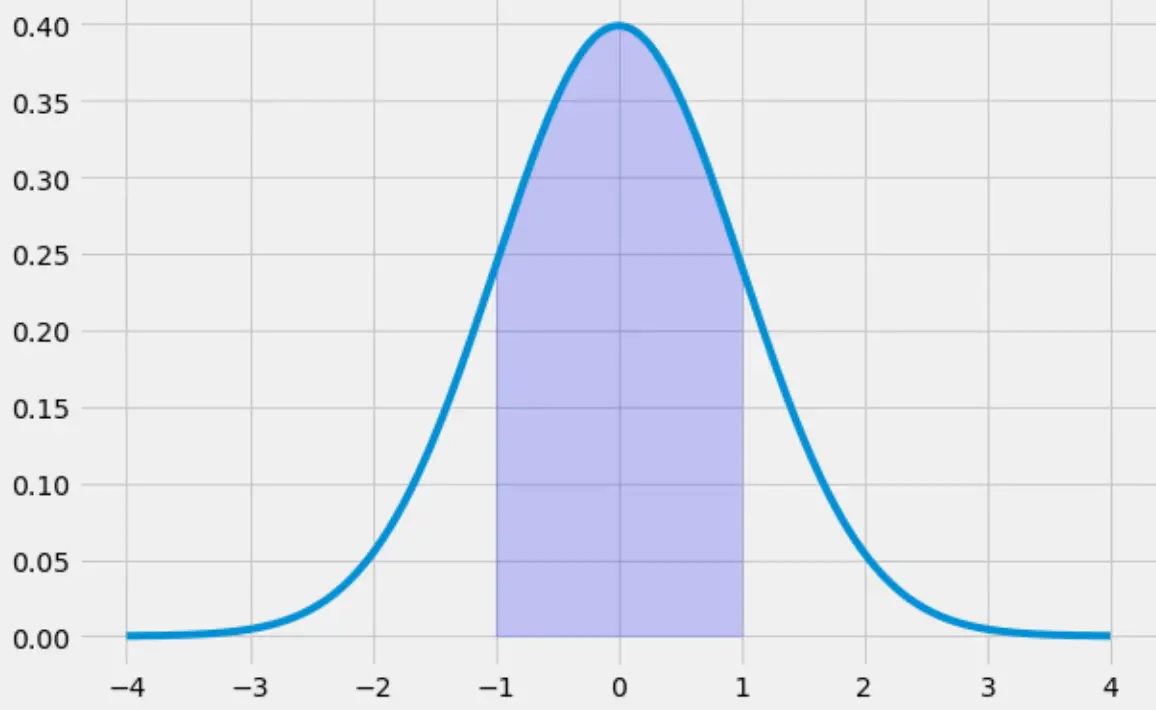
يوضح التعليمة البرمجية التالية كيفية ملء المنطقة الموجودة أسفل منحنى الجرس من -1 إلى 1:
 x = np.arange(-4, 4, 0.001)
y = norm.pdf(x,0,1)

fig, ax = plt.subplots(figsize=(9,6))
ax.plot(x,y)

#specify the region of the bell curve to fill in
x_fill = np.arange(-1, 1, 0.001)
y_fill = norm.pdf(x_fill,0,1)
ax.fill_between(x_fill,y_fill,0, alpha=0.2, color='blue')

plt.style.use('fivethirtyeight')
plt.show()

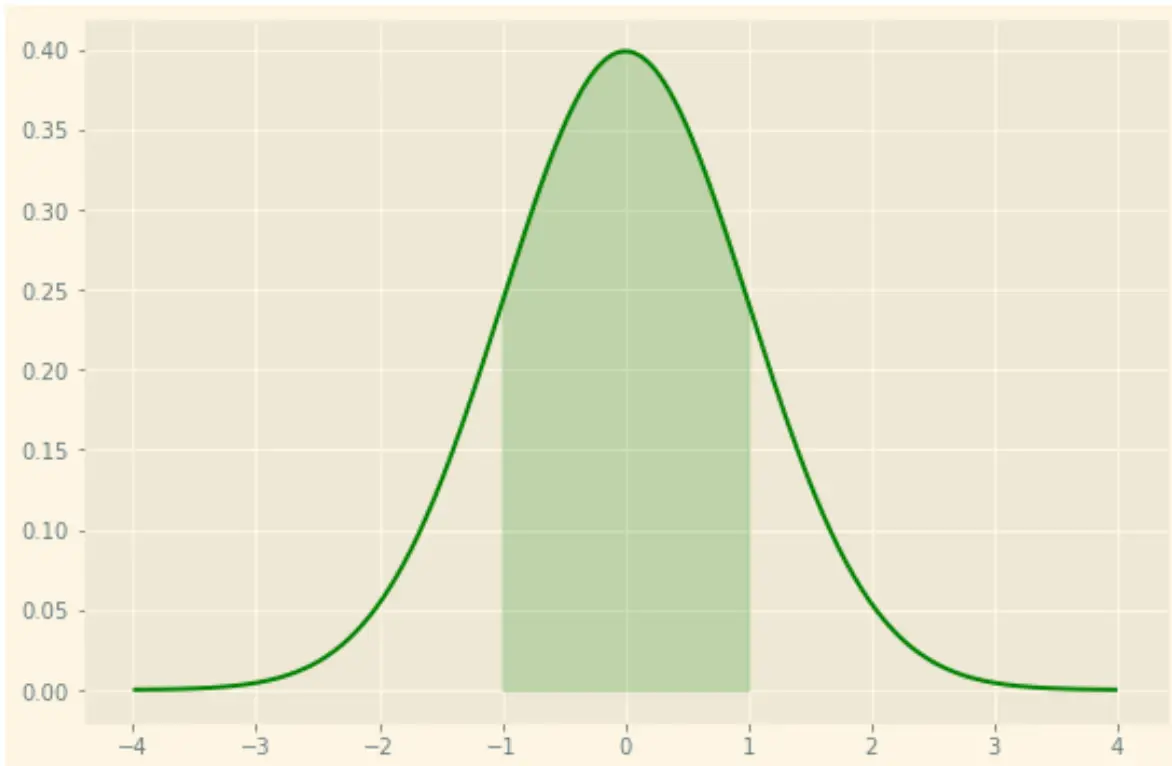
لاحظ أنه يمكنك أيضًا تصميم الحبكة بالطريقة التي تريدها باستخدام خيارات التصميم العديدة في matplotlib . على سبيل المثال، يمكنك استخدام سمة “ضوء الشمس” بخط أخضر وتظليل أخضر:
 x = np.arange(-4, 4, 0.001)
y = norm.pdf(x,0,1)

fig, ax = plt.subplots(figsize=(9,6))
ax.plot(x,y, color=' green ')

#specify the region of the bell curve to fill in
x_fill = np.arange(-1, 1, 0.001)
y_fill = norm.pdf(x_fill,0,1)
ax.fill_between(x_fill,y_fill,0, alpha=0.2, color=' green ')

plt.style.use(' Solarize_Light2 ')
plt.show()

يمكنك العثور على الدليل المرجعي الكامل لورقة الأنماط لـ matplotlib هنا .