كيفية ضبط حجم الحبكة الفرعية في matplotlib
يمكنك استخدام بناء الجملة التالي لضبط حجم المخططات الفرعية في Matplotlib:
 #specify one size for all subplots
fig, ax = plt. subplots (2, 2, figsize=(10,7))

#specify individual sizes for subplots
fig, ax = plt. subplots (1, 2, gridspec_kw={' width_ratios ': [3, 1]})
توضح الأمثلة التالية كيفية استخدام بناء الجملة هذا عمليًا.
مثال 1: حدد حجمًا لجميع المخططات الفرعية
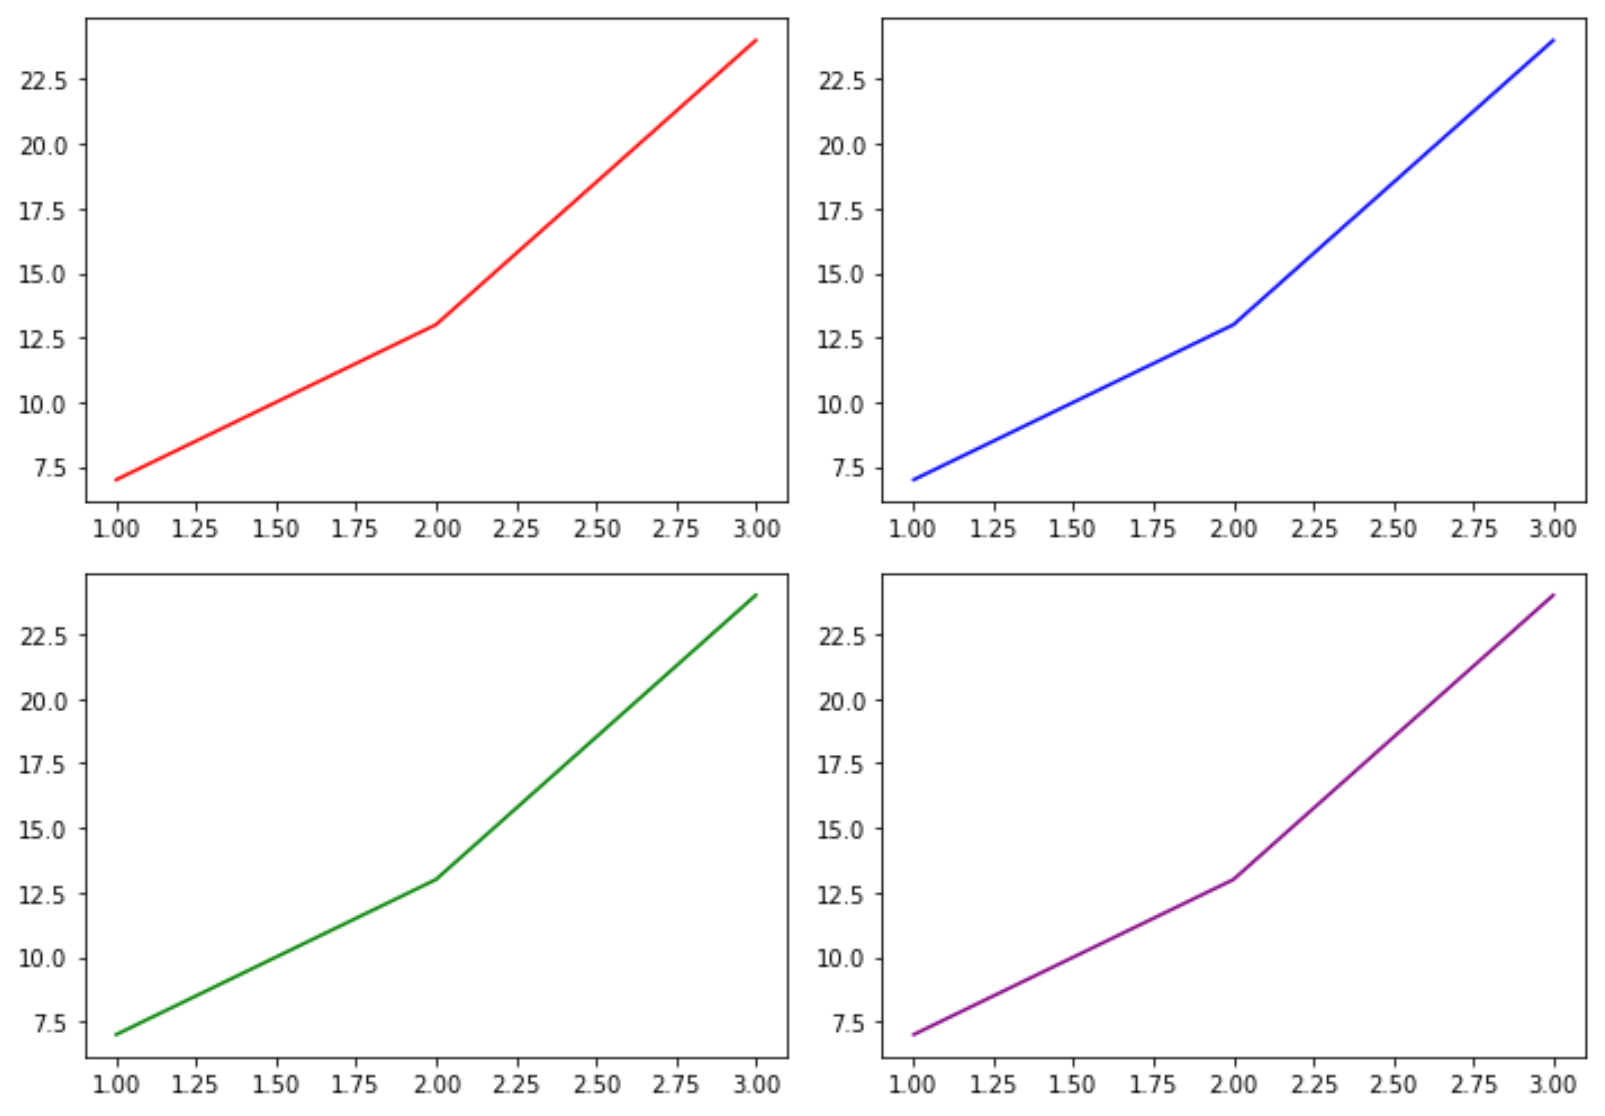
يوضح التعليمة البرمجية التالية كيفية تحديد حجم لجميع المخططات الفرعية:
 import matplotlib. pyplot as plt

#define subplots
fig, ax = plt. subplots (2, 2, figsize=(10,7))
fig. tight_layout ()

#define data
x = [1, 2, 3]
y = [7, 13, 24]

#create subplots
ax[0, 0]. plot (x,y,color=' red ')
ax[0, 1]. plot (x,y,color=' blue ')
ax[1, 0]. plot (x,y,color=' green ')
ax[1, 1]. plot (x,y,color=' purple ')

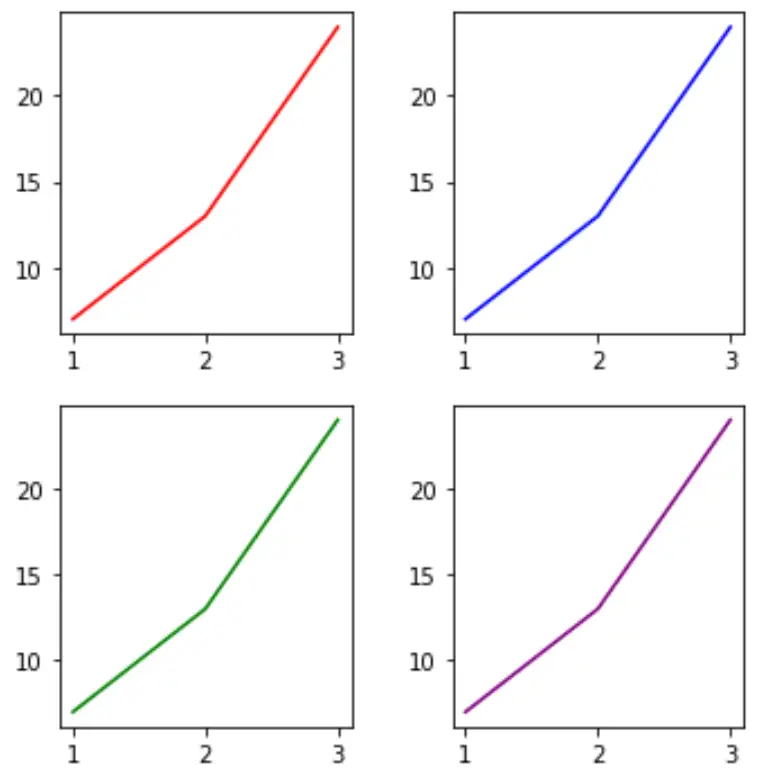
يمكننا بسهولة تغيير حجم العناصر الفرعية عن طريق تغيير قيم وسيطة Figsize :
 import matplotlib. pyplot as plt

#define subplots
fig, ax = plt. subplots (2, 2, figsize=(5,5))
fig. tight_layout ()

#define data
x = [1, 2, 3]
y = [7, 13, 24]

#create subplots
ax[0, 0]. plot (x,y,color=' red ')
ax[0, 1]. plot (x,y,color=' blue ')
ax[1, 0]. plot (x,y,color=' green ')
ax[1, 1]. plot (x,y,color=' purple ')

مثال 2: تحديد أحجام المخططات الفرعية الفردية
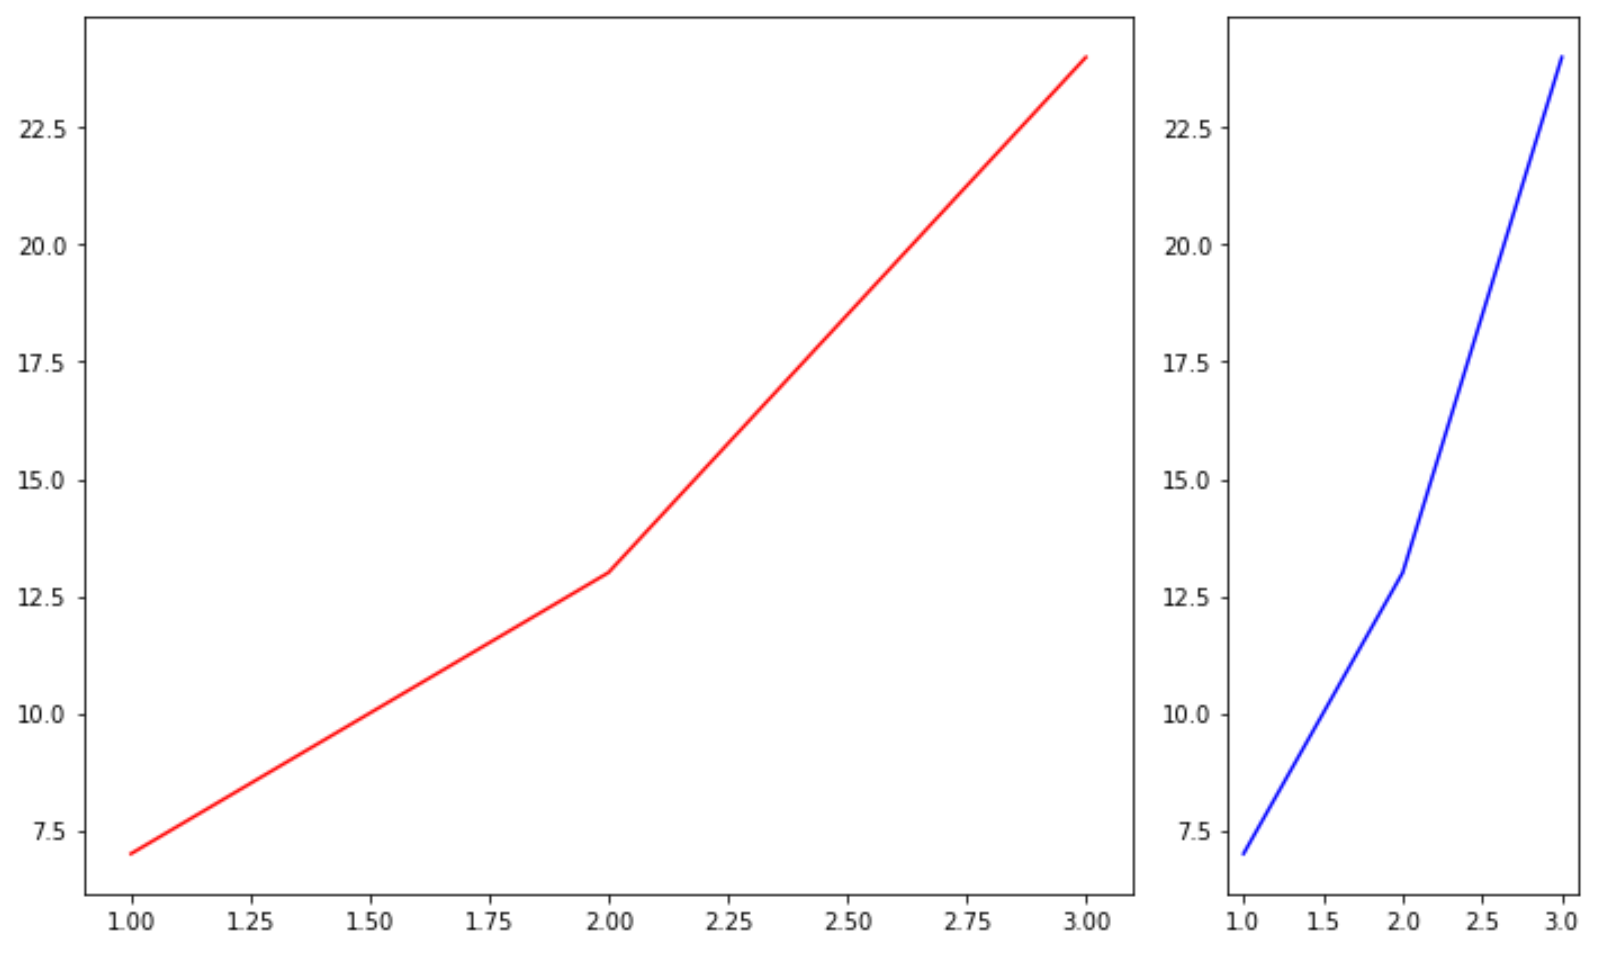
يوضح التعليمة البرمجية التالية كيفية تحديد أحجام مختلفة للمخططات الفرعية الفردية:
 import matplotlib. pyplot as plt

#define subplots
fig, ax = plt. subplots (1, 2, gridspec_kw={' width_ratios ': [3, 1]})
fig. tight_layout ()

#define data
x = [1, 2, 3]
y = [7, 13, 24]

#create subplots
ax[0]. plot (x,y,color=' red ')
ax[1]. plot (x,y,color=' blue ')

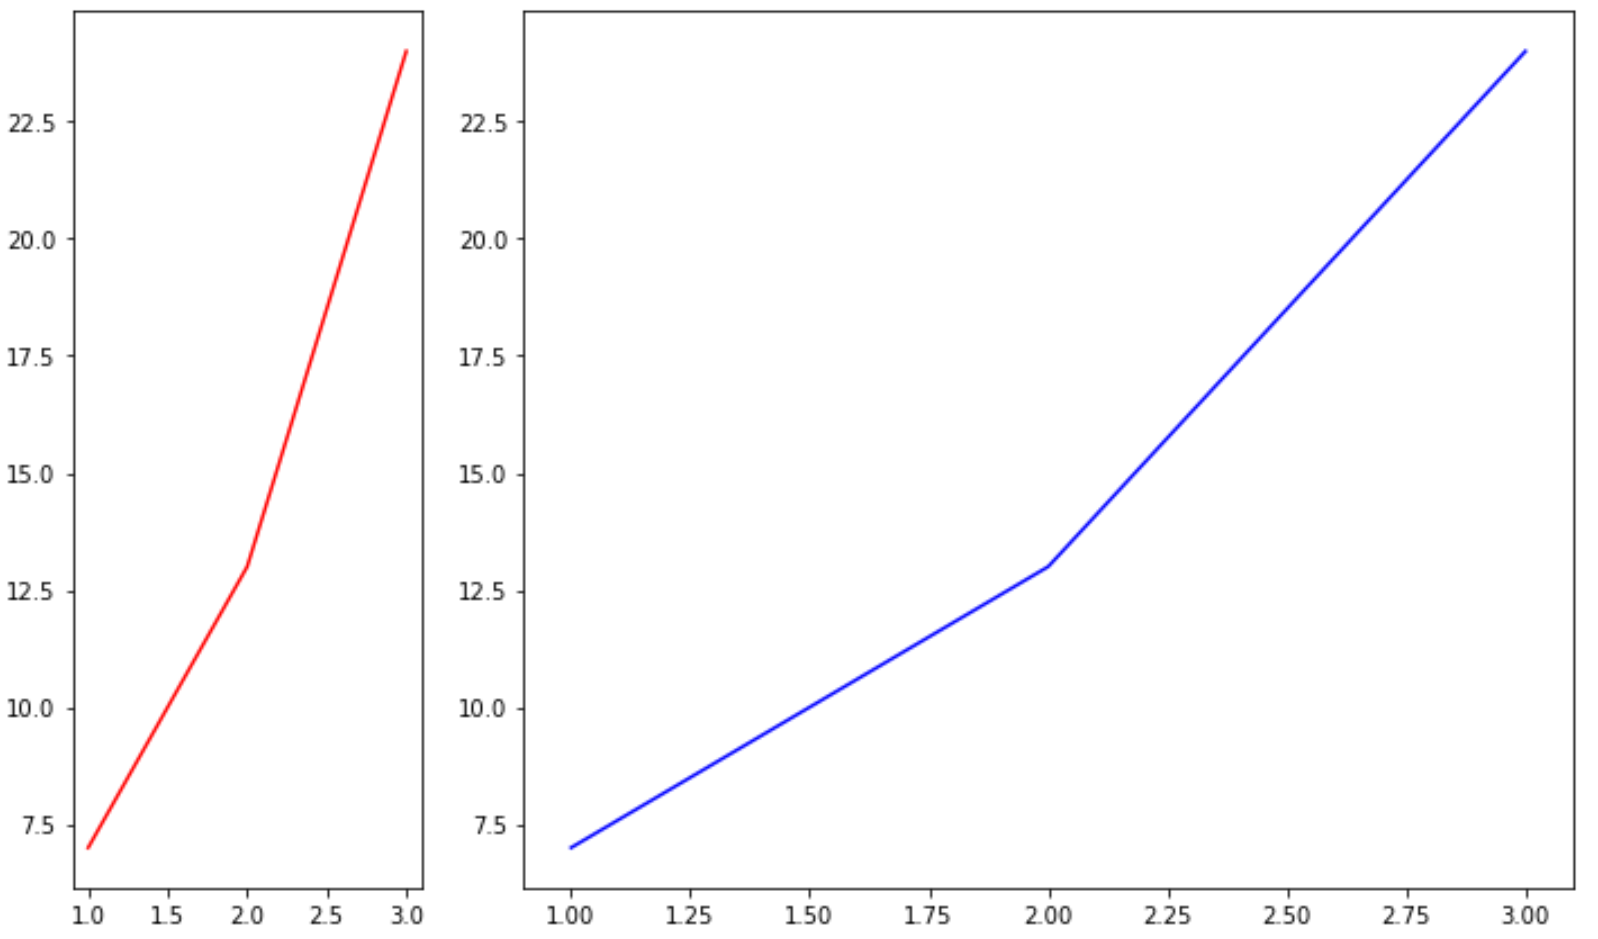
يمكننا بسهولة تغيير حجم العناصر الفرعية عن طريق تغيير القيم في وسيطة width_ratios :
 import matplotlib. pyplot as plt

#define subplots
fig, ax = plt. subplots (1, 2, gridspec_kw={' width_ratios ': [1, 3]})
fig. tight_layout ()

#define data
x = [1, 2, 3]
y = [7, 13, 24]

#create subplots
ax[0]. plot (x,y,color=' red ')
ax[1]. plot (x,y,color=' blue ')

مصادر إضافية
كيفية إضافة عناوين إلى المؤامرات في Matplotlib
كيفية تعيين نطاقات المحور في Matplotlib
كيفية تعيين قيم المحور X في Matplotlib