كيفية رسم الدوائر في matplotlib (مع أمثلة)
يمكنك إضافة دوائر بسرعة إلى قطعة أرض في Matplotlib باستخدام وظيفة Circle() ، والتي تستخدم بناء الجملة التالي:
matplotlib.patches.Circle(xy, radius=5)
ذهب:
- xy: إحداثيات الدائرة (x، y).
- نصف القطر: نصف قطر الدائرة. الافتراضي هو 5.
يوضح هذا البرنامج التعليمي عدة أمثلة للاستخدام العملي لهذه الوظيفة:
مثال 1: إنشاء دائرة واحدة
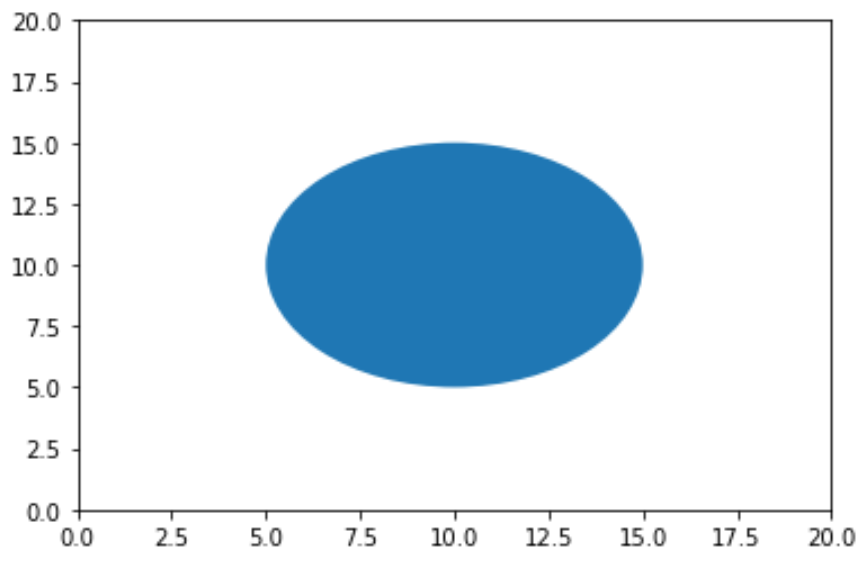
يوضح الكود التالي كيفية إنشاء دائرة واحدة على مخطط Matplotlib الموجود عند الإحداثيات (x,y)(10,10):
 import matplotlib. pyplot as plt

#set axis limits of plot (x=0 to 20, y=0 to 20)
plt. axis ([0, 20, 0, 20])

#create circle with (x, y) coordinates at (10, 10)
c=plt. Circle ((10, 10))

#add circle to plot (gca means "get current axis")
plt. gca (). add_artist (c)

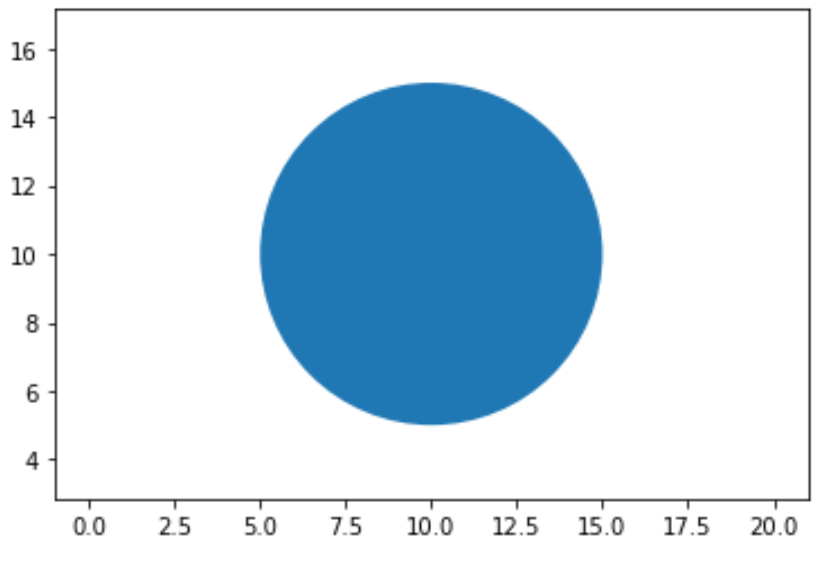
بشكل افتراضي، يعرض محور مخطط Matplotlib بشكل عام المزيد من وحدات البكسل لكل وحدة من البيانات. لجعل الدائرة تظهر كدائرة بدلاً من شكل بيضاوي، يجب عليك استخدام الوسيطة plt.axis(“equal”) كما يلي:
 import matplotlib. pyplot as plt

#set axis limits of plot (x=0 to 20, y=0 to 20)
plt. axis ([0, 20, 0, 20])
plt. axis (" equal ")

#create circle with (x, y) coordinates at (10, 10)
c=plt. Circle ((10, 10))

#add circle to plot (gca means "get current axis")
plt. gca (). add_artist (c)

المثال 2: إنشاء دوائر متعددة
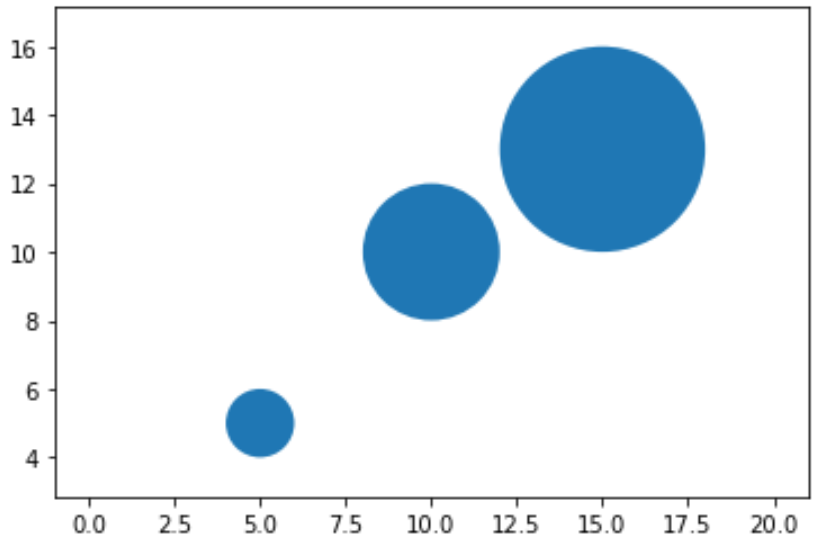
يوضح التعليمة البرمجية التالية كيفية إنشاء دوائر متعددة على مؤامرة Matplotlib:
 import matplotlib. pyplot as plt

#set axis limits of plot (x=0 to 20, y=0 to 20)
plt. axis ([0, 20, 0, 20])
plt. axis (" equal ")

#define circles
c1=plt. Circle ((5, 5), radius= 1 )
c2=plt. Circle ((10, 10), radius= 2 )
c3=plt. Circle ((15, 13), radius= 3 )

#add circles to plot
plt. gca (). add_artist (c1)
plt. gca (). add_artist (c2)
plt. gca (). add_artist (c3)

مثال 3: تغيير مظهر الدائرة
يمكنك استخدام الوسائط التالية لتغيير مظهر الدائرة في Matplotlib:
- نصف القطر: تحديد نصف قطر الدائرة
- اللون: تحديد لون الدائرة
- ألفا: تحديد شفافية الدائرة
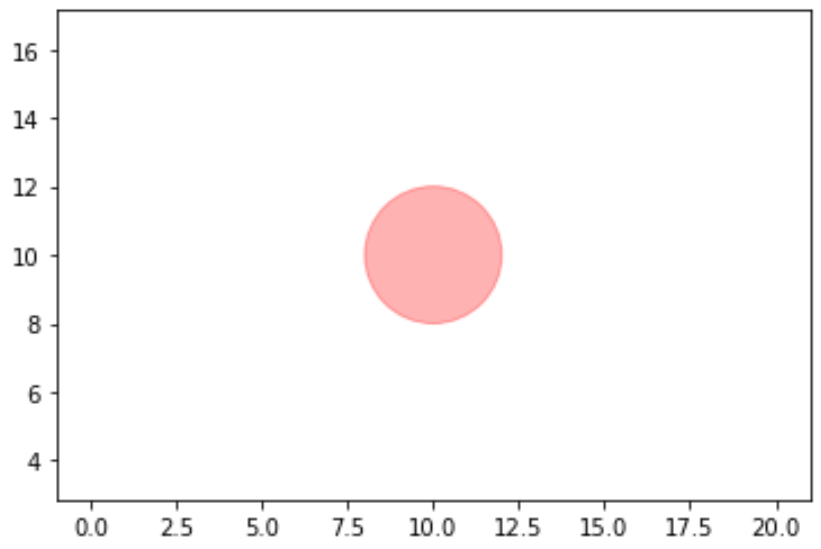
يعرض التعليمة البرمجية التالية مثالاً لكيفية استخدام العديد من هذه الوسائط في وقت واحد:
 import matplotlib. pyplot as plt

#set axis limits of plot (x=0 to 20, y=0 to 20)
plt. axis ([0, 20, 0, 20])
plt. axis (" equal ")

#create circle with (x, y) coordinates at (10, 10)
c=plt. Circle ((10, 10), radius= 2 , color=' red ', alpha= .3 )

#add circle to plot (gca means "get current axis")
plt. gca (). add_artist (c)

لاحظ أنه يمكنك أيضًا استخدام رموز الألوان السداسية العشرية المخصصة لتحديد لون الدوائر.