كيفية إضافة نص إلى مؤامرات matplotlib (مع أمثلة)
يمكنك بسهولة إضافة نص إلى مؤامرة Matplotlib باستخدام وظيفة matplotlib.pyplot.text() ، والتي تستخدم بناء الجملة التالي:
matplotlib.pyplot.text(x, y, s, Fontdict=None)
ذهب:
- x: الإحداثي x للنص
- y: إحداثي y للنص
- s: السلسلة النصية
- Fontdict: قاموس لتجاوز خصائص النص الافتراضية
يوضح هذا البرنامج التعليمي عدة أمثلة للاستخدام العملي لهذه الوظيفة.
مثال 1: إضافة نص فريد إلى مخطط Matplotlib
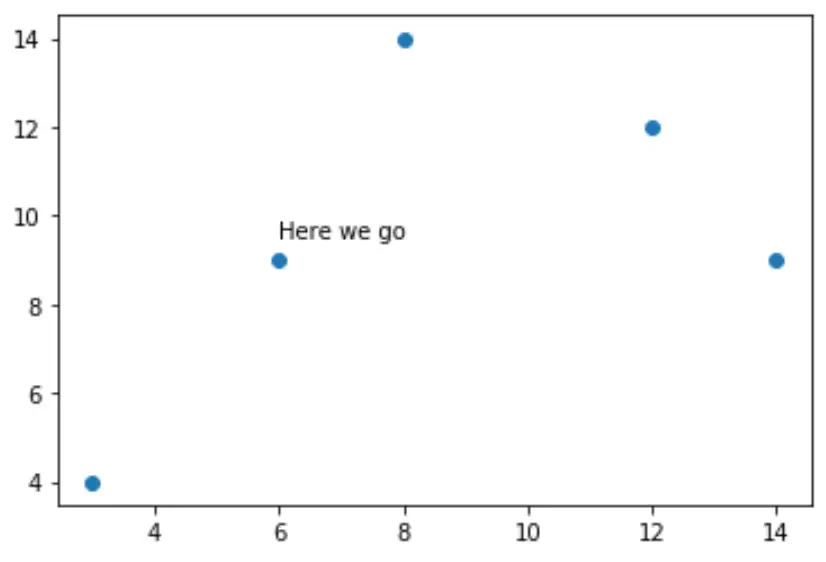
يوضح التعليمة البرمجية التالية كيفية إنشاء مخطط مبعثر وإضافة جزء واحد من النص إلى المخطط:
 import matplotlib. pyplot as plt

#createdata
x = [3, 6, 8, 12, 14]
y = [4, 9, 14, 12, 9]

#create scatterplot
plt. scatter (x,y)

#add text at (x, y) coordinates = (6, 9.5)
plt. text (6, 9.5, ' Here we go ')

مثال 2: إضافة نصوص متعددة إلى مؤامرة Matplotlib
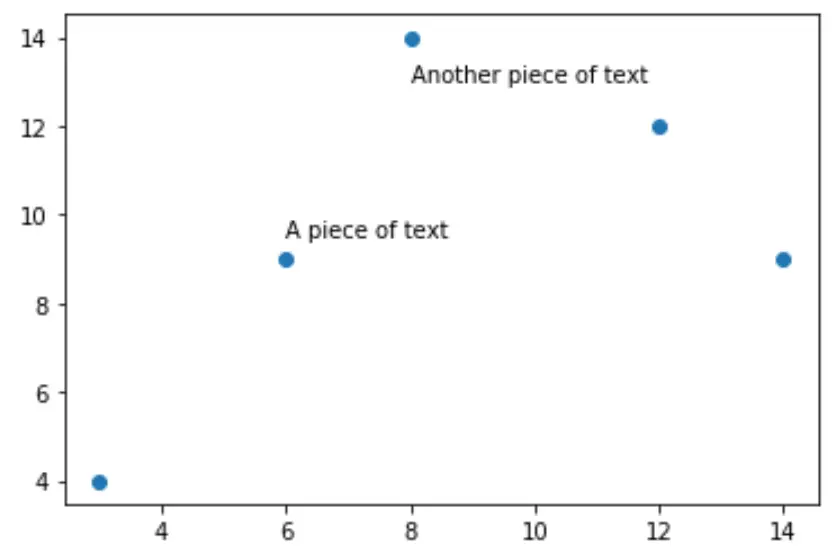
يوضح التعليمة البرمجية التالية كيفية إنشاء مخطط مبعثر وإضافة أجزاء متعددة من النص إلى المخطط:
 import matplotlib. pyplot as plt

#create data
x = [3, 6, 8, 12, 14]
y = [4, 9, 14, 12, 9]

#create scatterplot
plt. scatter (x,y)

#add text at (x, y) coordinates = (6, 9.5)
plt. text (6, 9.5, ' A piece of text ')

#add another piece of text
plt. text (8, 13, ' Another piece of text ')

المثال 3: تحرير خصائص النص
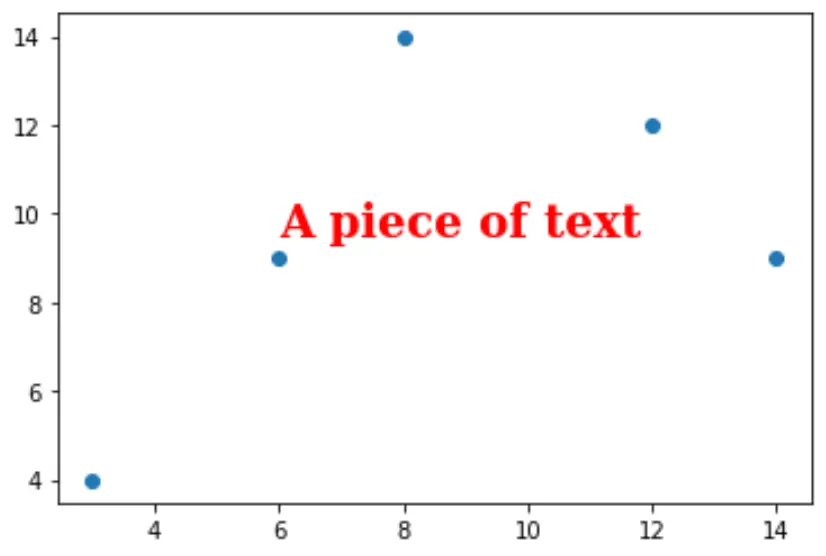
لتغيير خصائص النص، يمكننا إنشاء قاموس يحدد خصائص الخط.
يوضح الكود التالي كيفية القيام بذلك:
 import matplotlib. pyplot as plt

#createdata
x = [3, 6, 8, 12, 14]
y = [4, 9, 14, 12, 9]

#create scatterplot
plt. scatter (x,y)

font = {' family ': ' serif ',
        ' color ': ' red ',
        ' weight ': ' bold ',
        ' size ': 20
        }

#add text with custom font
plt. text (6, 9.5, ' A piece of text ', fontdict=font)

مثال 4: إضافة إطار حول النص
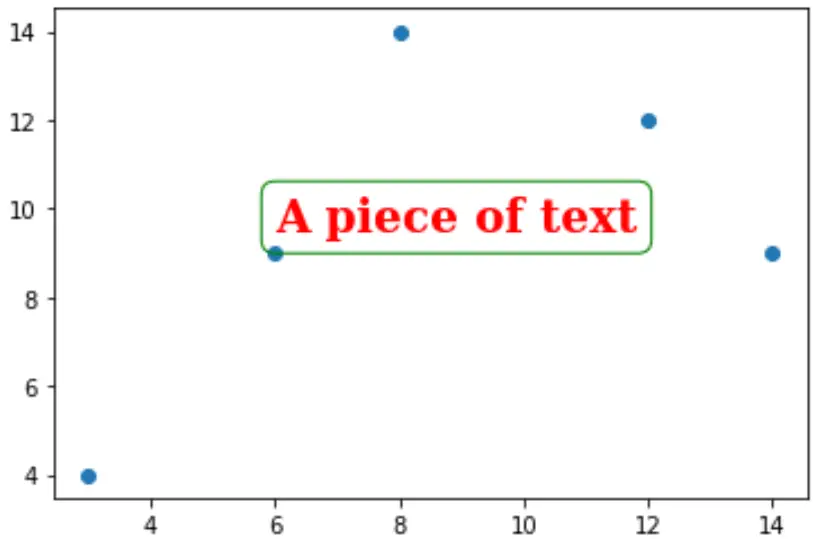
يوضح التعليمة البرمجية التالية كيفية إضافة إطار حول النص:
 import matplotlib. pyplot as plt

#createdata
x = [3, 6, 8, 12, 14]
y = [4, 9, 14, 12, 9]

#create scatterplot
plt. scatter (x,y)

font = {' family ': ' serif ',
        ' color ': ' red ',
        ' weight ': ' bold ',
        ' size ': 20
        }

box = {' facecolor ': ' none ',
       ' edgecolor ': ' green ',
       ' boxstyle ': ' round '
      }

#add text with custom font
plt. text (6, 9.5, ' A piece of text ', fontdict=font, bbox=box)

مصادر إضافية
كيفية إضافة تعليق توضيحي إلى Matplotlib scatterplots
كيفية تغيير حجم الخط على مؤامرة Matplotlib