كيفية إنشاء مخططات شريطية مكدسة في matplotlib (مع أمثلة)
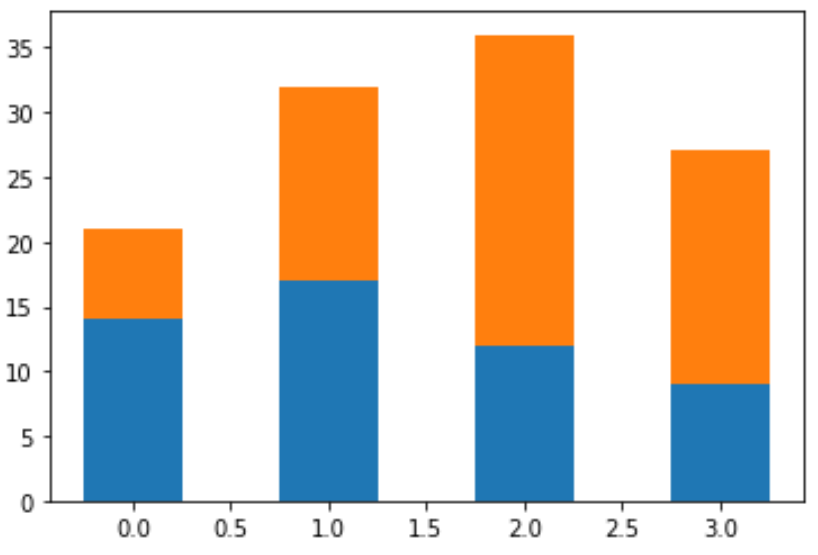
المخطط الشريطي المكدس هو نوع من المخططات التي تستخدم الأشرطة لعرض ترددات الفئات المختلفة.
يمكننا إنشاء هذا النوع من المخططات في Matplotlib باستخدام وظيفة matplotlib.pyplot.bar() .
يوضح هذا البرنامج التعليمي كيفية استخدام هذه الوظيفة عمليًا.
إنشاء مخطط شريطي مكدس أساسي
يوضح التعليمة البرمجية التالية كيفية إنشاء مخطط شريطي مكدس لعرض إجمالي مبيعات منتجين في أربعة أرباع مبيعات مختلفة:
 import numpy as np
import matplotlib.pyplot as plt

#createdata
quarter = ['Q1', 'Q2', 'Q3', 'Q4']
product_A = [14, 17, 12, 9]
product_B = [7, 15, 24, 18]

#define chart parameters
N = 4
barWidth = .5
xloc = np. orange (N)

#display stacked bar chart
p1 = plt. bar (xloc, product_A, width=barWidth)
p2 = plt. bar (xloc, product_B, bottom=product_A, width=barWidth)
plt. show ()

أضف عنوانًا وتسميات وتعليقات توضيحية
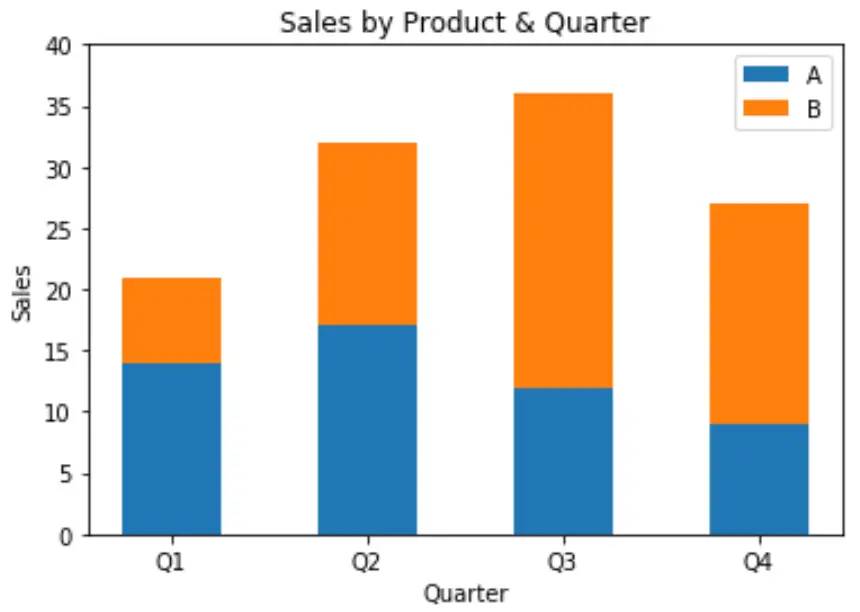
يمكننا أيضًا إضافة عنوان وتسميات وعلامات تجزئة ووسيلة إيضاح لتسهيل قراءة المخطط:
 import numpy as np
import matplotlib.pyplot as plt

#create data for two teams
quarter = ['Q1', 'Q2', 'Q3', 'Q4']
product_A = [14, 17, 12, 9]
product_B = [7, 15, 24, 18]

#define chart parameters
N = 4
barWidth = .5
xloc = np. orange (N)

#create stacked bar chart
p1 = plt. bar (xloc, product_A, width=barWidth)
p2 = plt. bar (xloc, product_B, bottom=product_A, width=barWidth)

#add labels, title, tick marks, and legend
plt. ylabel ('Sales')
plt. xlabel ('Quarter')
plt. title ('Sales by Product & Quarter')
plt. xticks (xloc, ('Q1', 'Q2', 'Q3', 'Q4'))
plt. yticks (np. arange (0, 41, 5))
plt. legend ((p1[0], p2[0]), ('A', 'B'))

#displaychart
plt. show ()

تخصيص ألوان الرسم البياني
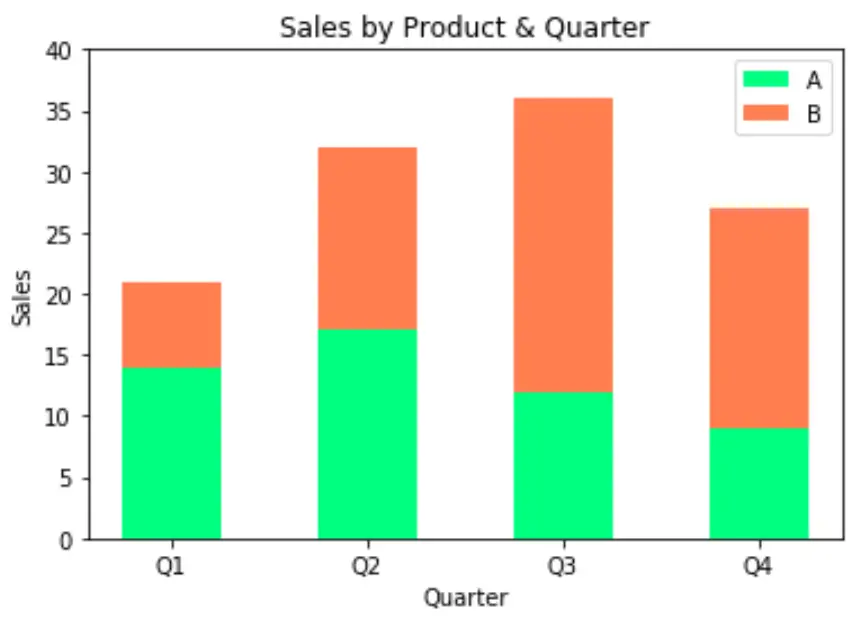
أخيرًا، يمكننا تخصيص الألوان المستخدمة في المخطط باستخدام وسيطة colors() في plt.bar() :
 import numpy as np
import matplotlib.pyplot as plt

#create data for two teams
quarter = ['Q1', 'Q2', 'Q3', 'Q4']
product_A = [14, 17, 12, 9]
product_B = [7, 15, 24, 18]

#define chart parameters
N = 4
barWidth = .5
xloc = np. orange (N)

#create stacked bar chart
p1 = plt. bar (xloc, product_A, width=barWidth, color=' springgreen ')
p2 = plt. bar (xloc, product_B, bottom=product_A, width=barWidth, color=' coral ')

#add labels, title, tick marks, and legend
plt. ylabel ('Sales')
plt. xlabel ('Quarter')
plt. title ('Sales by Product & Quarter')
plt. xticks (xloc, ('Q1', 'Q2', 'Q3', 'Q4'))
plt. yticks (np. arange (0, 41, 5))
plt. legend ((p1[0], p2[0]), ('A', 'B'))

#displaychart
plt. show ()

يمكنك العثور على قائمة كاملة بالألوان المتوفرة في وثائق Matplotlib.
مصادر إضافية
تشرح البرامج التعليمية التالية كيفية تنفيذ المهام الشائعة الأخرى في Matplotlib:
كيفية تغيير حجم الخط على مؤامرة Matplotlib
كيفية إزالة القراد من مؤامرات Matplotlib
كيفية إظهار خطوط الشبكة على مؤامرات Matplotlib