كيفية إنشاء مخطط الشمعدان باستخدام matplotlib في بايثون
مخطط الشمعدان هو نوع من المخططات المالية التي تعرض تحركات أسعار الأوراق المالية مع مرور الوقت.
يوضح المثال التالي كيفية إنشاء مخطط شمعدان باستخدام مكتبة التصور Matplotlib في Python.
مثال: إنشاء مخطط شمعدان في بايثون
لنفترض أن لدينا DataFrame الباندا التالي الذي يوضح سعر الفتح والإغلاق والسعر المرتفع والمنخفض لسهم معين خلال فترة 8 أيام:
 import pandas as pd

#createDataFrame
prices = pd. DataFrame ({' open ': [25, 22, 21, 19, 23, 21, 25, 29],
                       ' close ': [24, 20, 17, 23, 22, 25, 29, 31],
                       ' high ': [28, 27, 29, 25, 24, 26, 31, 37],
                       ' low ': [22, 16, 14, 17, 19, 18, 22, 26]},
                       index=pd. date_range (" 2021-01-01 ", periods=8, freq=" d "))

#display DataFrame
print (prices)

            open close high low
2021-01-01 25 24 28 22
2021-01-02 22 20 27 16
2021-01-03 21 17 29 14
2021-01-04 19 23 25 17
2021-01-05 23 22 24 19
2021-01-06 21 25 26 18
2021-01-07 25 29 31 22
2021-01-08 29 31 37 26
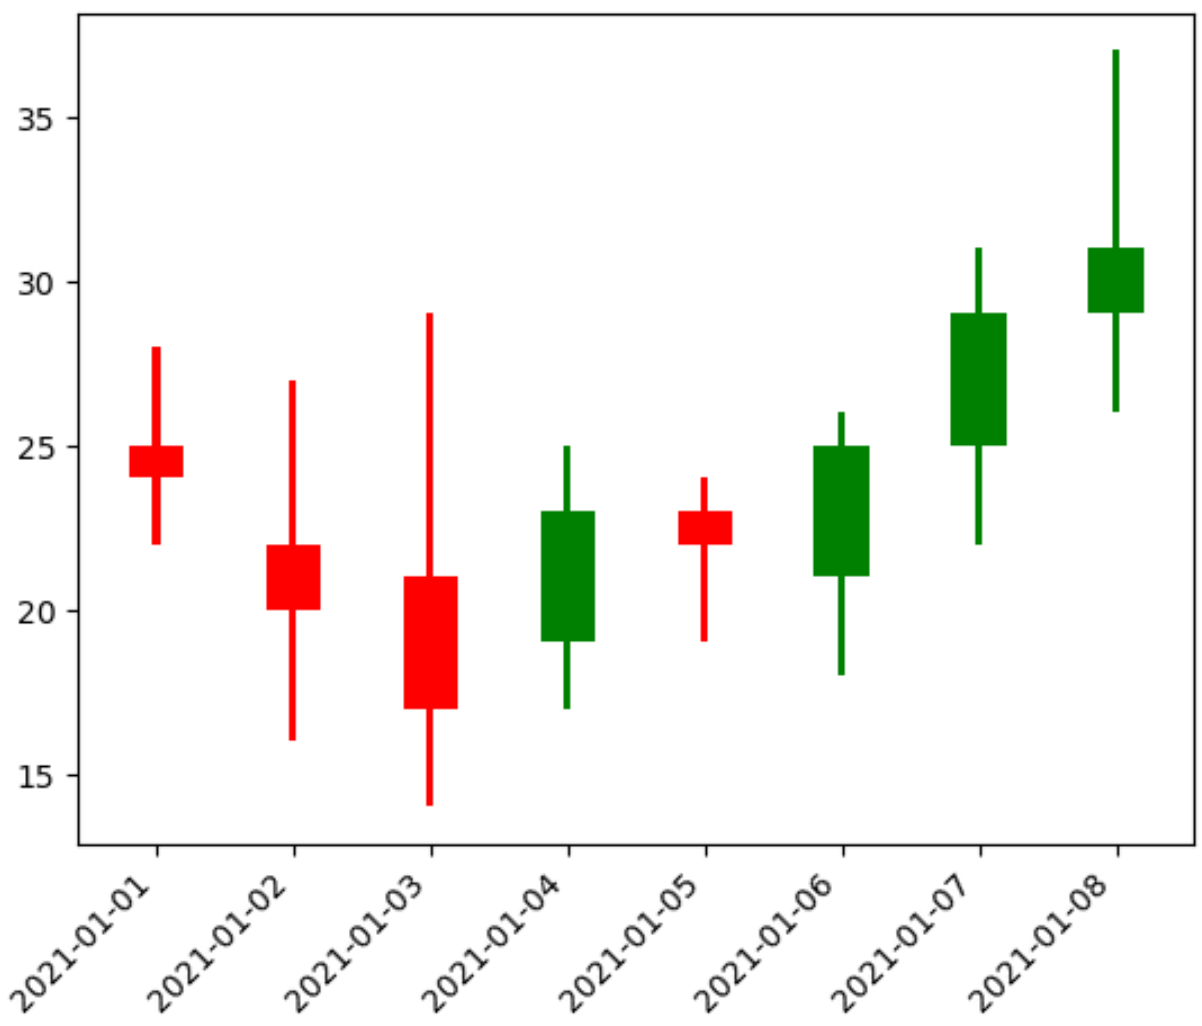
يمكننا استخدام الكود التالي لإنشاء مخطط شمعدان لتصور تحركات سعر هذا السهم خلال فترة الثمانية أيام:
 import matplotlib. pyplot as plt

#create figure
plt. figure ()

#define width of candlestick elements
width = .4
width2 = .05

#define up and down prices
up = prices[prices. close >=prices. open ]
down = prices[prices. close <prices. open ]

#define colors to use
col1 = ' green '
col2 = ' red '

#plot up prices
plt. bar (up. index , up. close -up. open , width, bottom=up. open , color=col1)
plt. bar (up. index ,up. high -up. close ,width2,bottom=up. close ,color=col1)
plt. bar (up. index , up. low -up. open , width2, bottom=up. open , color=col1)

#plot down prices
plt. bar (down. index , down. close -down. open , width, bottom=down. open , color=col2)
plt. bar (down. index , down. high -down. open , width2, bottom=down. open , color=col2)
plt. bar (down. index ,down. low -down. close ,width2,bottom=down. close ,color=col2)

#rotate x-axis tick labels
plt. xticks (rotation= 45 , ha=' right ')

#display candlestick chart
plt. show ()

تمثل كل شمعدان التغير في سعر الورقة المالية في يوم معين. يخبرنا لون الشمعدان ما إذا كان السعر قد أغلق أعلى (أخضر) أو أقل (أحمر) مقارنة باليوم السابق.
لا تتردد في تغيير عرض الشموع والألوان المستخدمة لجعل الرسم البياني يظهر بالطريقة التي تريدها.
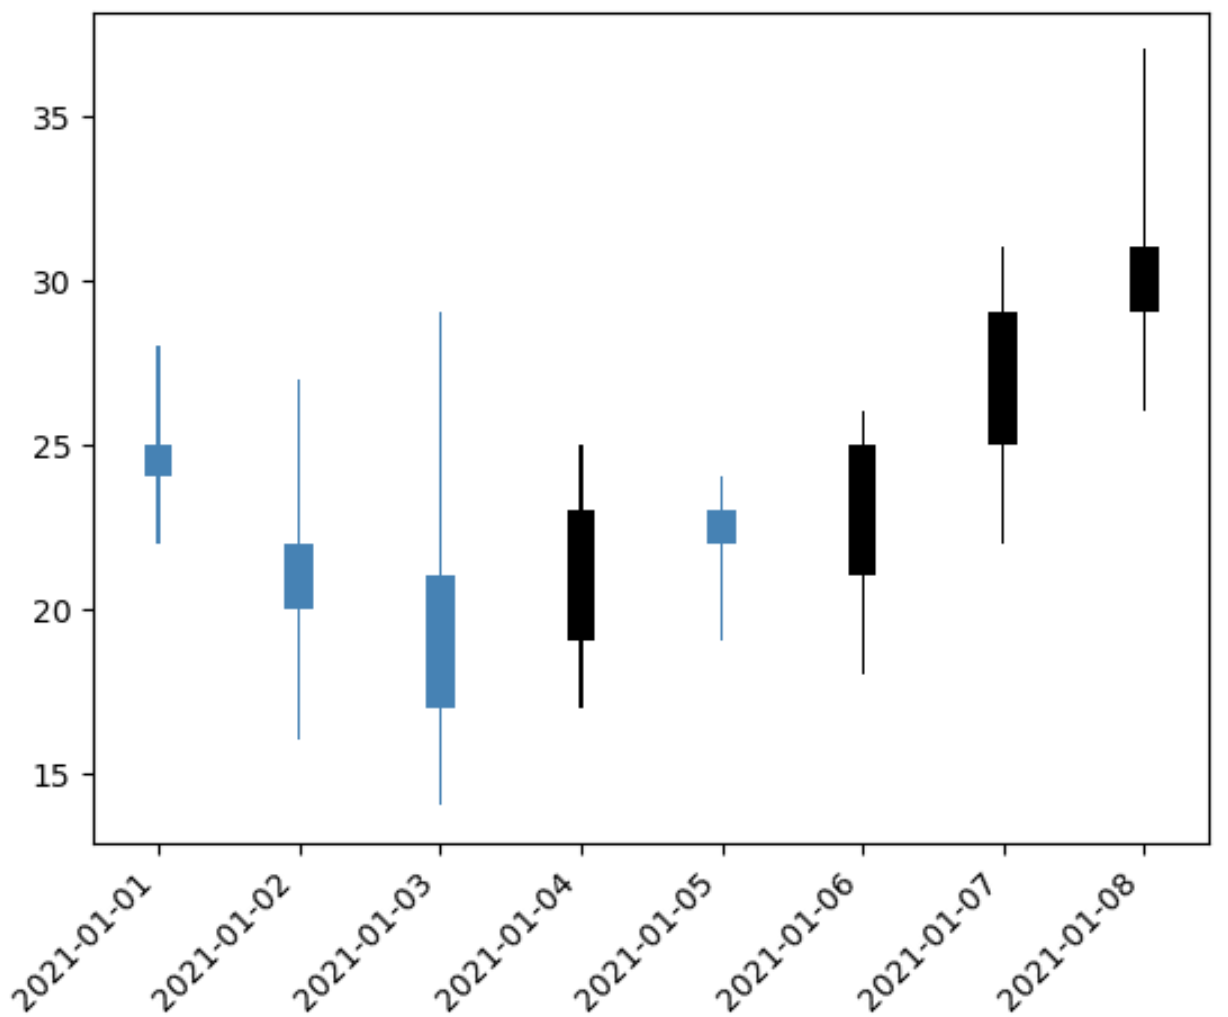
على سبيل المثال، يمكننا جعل الشموع أرق واستخدام ألوان مختلفة لتمثيل الأيام “الأعلى” و”المنخفضة”:
 import matplotlib. pyplot as plt

#create figure
plt. figure ()

#define width of candlestick elements
width = .2
width2 = .02

#define up and down prices
up = prices[prices. close >=prices. open ]
down = prices[prices. close <prices. open ]

#define colors to use
col1 = ' black '
col2 = ' steelblue '

#plot up prices
plt. bar (up. index , up. close -up. open , width, bottom=up. open , color=col1)
plt. bar (up. index ,up. high -up. close ,width2,bottom=up. close ,color=col1)
plt. bar (up. index , up. low -up. open , width2, bottom=up. open , color=col1)

#plot down prices
plt. bar (down. index , down. close -down. open , width, bottom=down. open , color=col2)
plt. bar (down. index , down. high -down. open , width2, bottom=down. open , color=col2)
plt. bar (down. index ,down. low -down. close ,width2,bottom=down. close ,color=col2)

#rotate x-axis tick labels
plt. xticks (rotation= 45 , ha=' right ')

#display candlestick chart
plt. show ()

مصادر إضافية
تشرح البرامج التعليمية التالية كيفية إنشاء مخططات شائعة أخرى في بايثون:
كيفية إنشاء مخططات Matplotlib متعددة على شكل واحد
كيفية رسم رسم بياني من قائمة البيانات في بايثون
كيفية إنشاء مخططات مربعة حسب المجموعة في بايثون