كيفية رسم توزيع مربع كاي في بايثون
لرسم توزيع مربع كاي في بايثون، يمكنك استخدام الصيغة التالية:
 #x-axis ranges from 0 to 20 with .001 steps
x = np. arange (0, 20, 0.001)

#plot Chi-square distribution with 4 degrees of freedom
plt. plot (x, chi2. pdf (x, df= 4 ))
تحدد المصفوفة x نطاق المحور السيني وينتج plt.plot() مخطط توزيع مربع كاي بدرجات الحرية المحددة.
توضح الأمثلة التالية كيفية استخدام هذه الوظائف عمليًا.
المثال 1: رسم توزيع مربع كاي المفرد
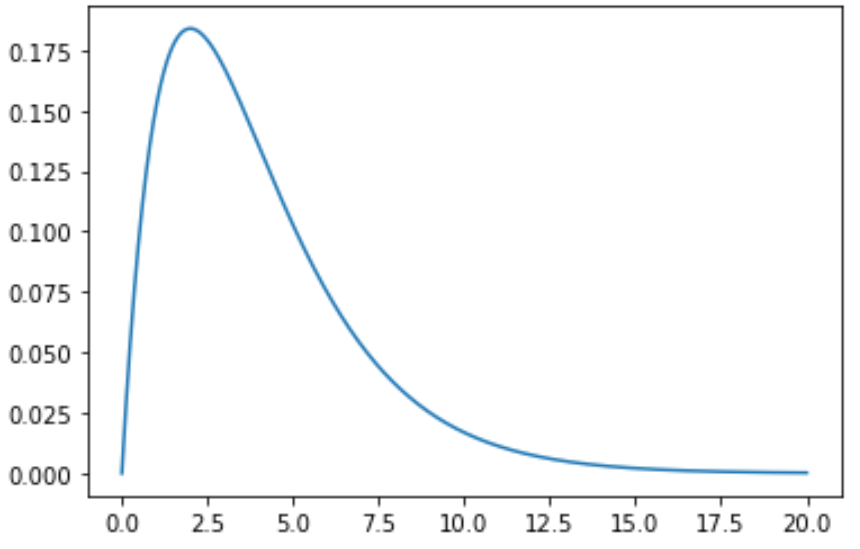
يوضح الكود التالي كيفية رسم منحنى توزيع مربع كاي مع 4 درجات حرية
 import numpy as np
import matplotlib. pyplot as plt
from scipy. stats import chi2

#x-axis ranges from 0 to 20 with .001 steps
x = np. arange (0, 20, 0.001)

#plot Chi-square distribution with 4 degrees of freedom
plt. plot (x, chi2. pdf (x, df= 4 ))

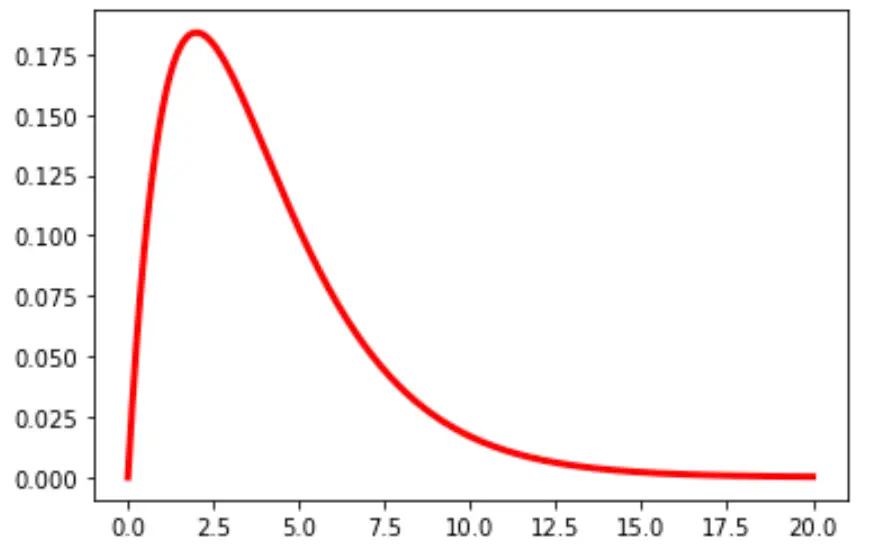
يمكنك أيضًا تغيير لون الخط وعرضه في المخطط:
plt. plot (x, chi2. pdf (x, df= 4 ), color=' red ', linewidth= 3 )

المثال 2: رسم توزيعات مربع كاي المتعددة
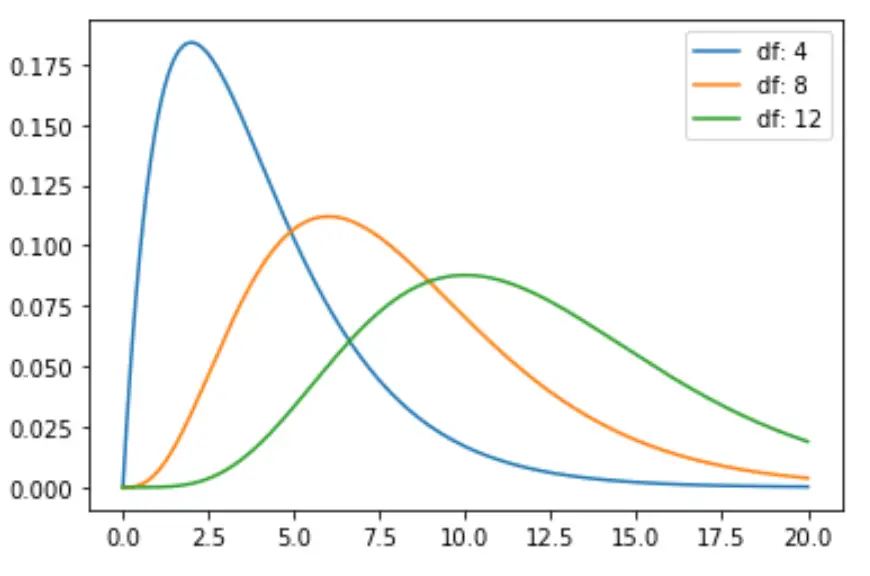
يوضح التعليمة البرمجية التالية كيفية رسم منحنيات توزيع مربع كاي المتعددة بدرجات مختلفة من الحرية:
 import numpy as np
import matplotlib. pyplot as plt
from scipy. stats import chi2

#x-axis ranges from 0 to 20 with .001 steps
x = np. arange (0, 20, 0.001)

#define multiple Chi-square distributions
plt. plot (x, chi2. pdf (x, df= 4 ), label=' df: 4 ')
plt. plot (x, chi2. pdf (x, df= 8 ), label=' df: 8 ')
plt. plot (x, chi2. pdf (x, df= 12 ), label=' df: 12 ')

#add legend to plot
plt. legend ()

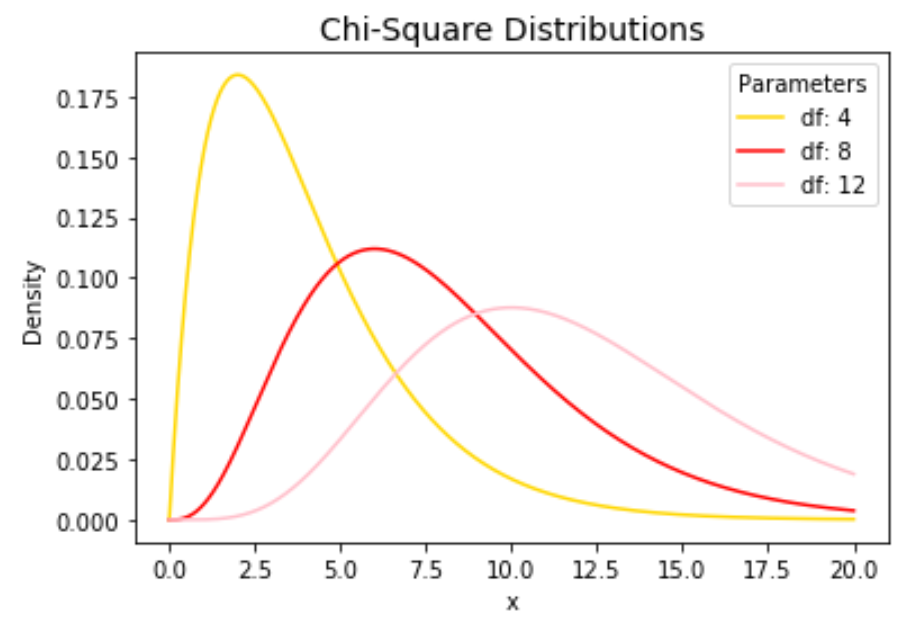
لا تتردد في تغيير ألوان الخطوط وإضافة تسميات العنوان والمحور لإكمال المخطط:
 import numpy as np
import matplotlib. pyplot as plt
from scipy. stats import chi2

#x-axis ranges from 0 to 20 with .001 steps
x = np. arange (0, 20, 0.001)

#define multiple Chi-square distributions
plt. plot (x, chi2. pdf (x, df= 4 ), label=' df: 4 ', color=' gold ')
plt. plot (x, chi2. pdf (x, df= 8 ), label=' df: 8 ', color=' red ')
plt. plot (x, chi2. pdf (x, df= 12 ), label=' df: 12 ', color=' pink ')

#add legend to plot
plt. legend (title=' Parameters ')

#add axes labels and a title
plt. ylabel (' Density ')
plt. xlabel (' x ')
plt. title (' Chi-Square Distributions ', fontsize= 14 )

ارجع إلى وثائق matplotlib للحصول على شرح تفصيلي لوظيفة plt.plot() .