如何在 r 中使用facet_wrap(带有示例)
facet_wrap()函数可用于在 ggplot2 中生成多面板图。
该函数使用以下基本语法:
 library (ggplot2)

ggplot(df, aes (x_var, y_var)) +
  geom_point() +
  facet_wrap(vars(category_var))
以下示例展示了如何将此函数与 R 中的内置mpg数据集一起使用:
 #view first six rows of mpg dataset
head(mpg)

manufacturer model displ year cyl trans drv cty hwy fl class

audi a4 1.8 1999 4 auto(l5) f 18 29 p compact
audi a4 1.8 1999 4 manual(m5) f 21 29 p compact
audi a4 2.0 2008 4 manual(m6) f 20 31 p compact
audi a4 2.0 2008 4 auto(front) f 21 30 p compact
audi a4 2.8 1999 6 auto(l5) f 16 26 p compact
audi a4 2.8 1999 6 manual(m5) f 18 26 p compact
示例1:facet_wrap()基本函数
以下代码展示了如何使用displ作为 x 轴变量、 hwy作为 y 轴变量、 class作为分组变量在 ggplot2 中创建多个散点图:
 ggplot(mpg, aes (displ, hwy)) +
  geom_point() +
  facet_wrap(vars(class))

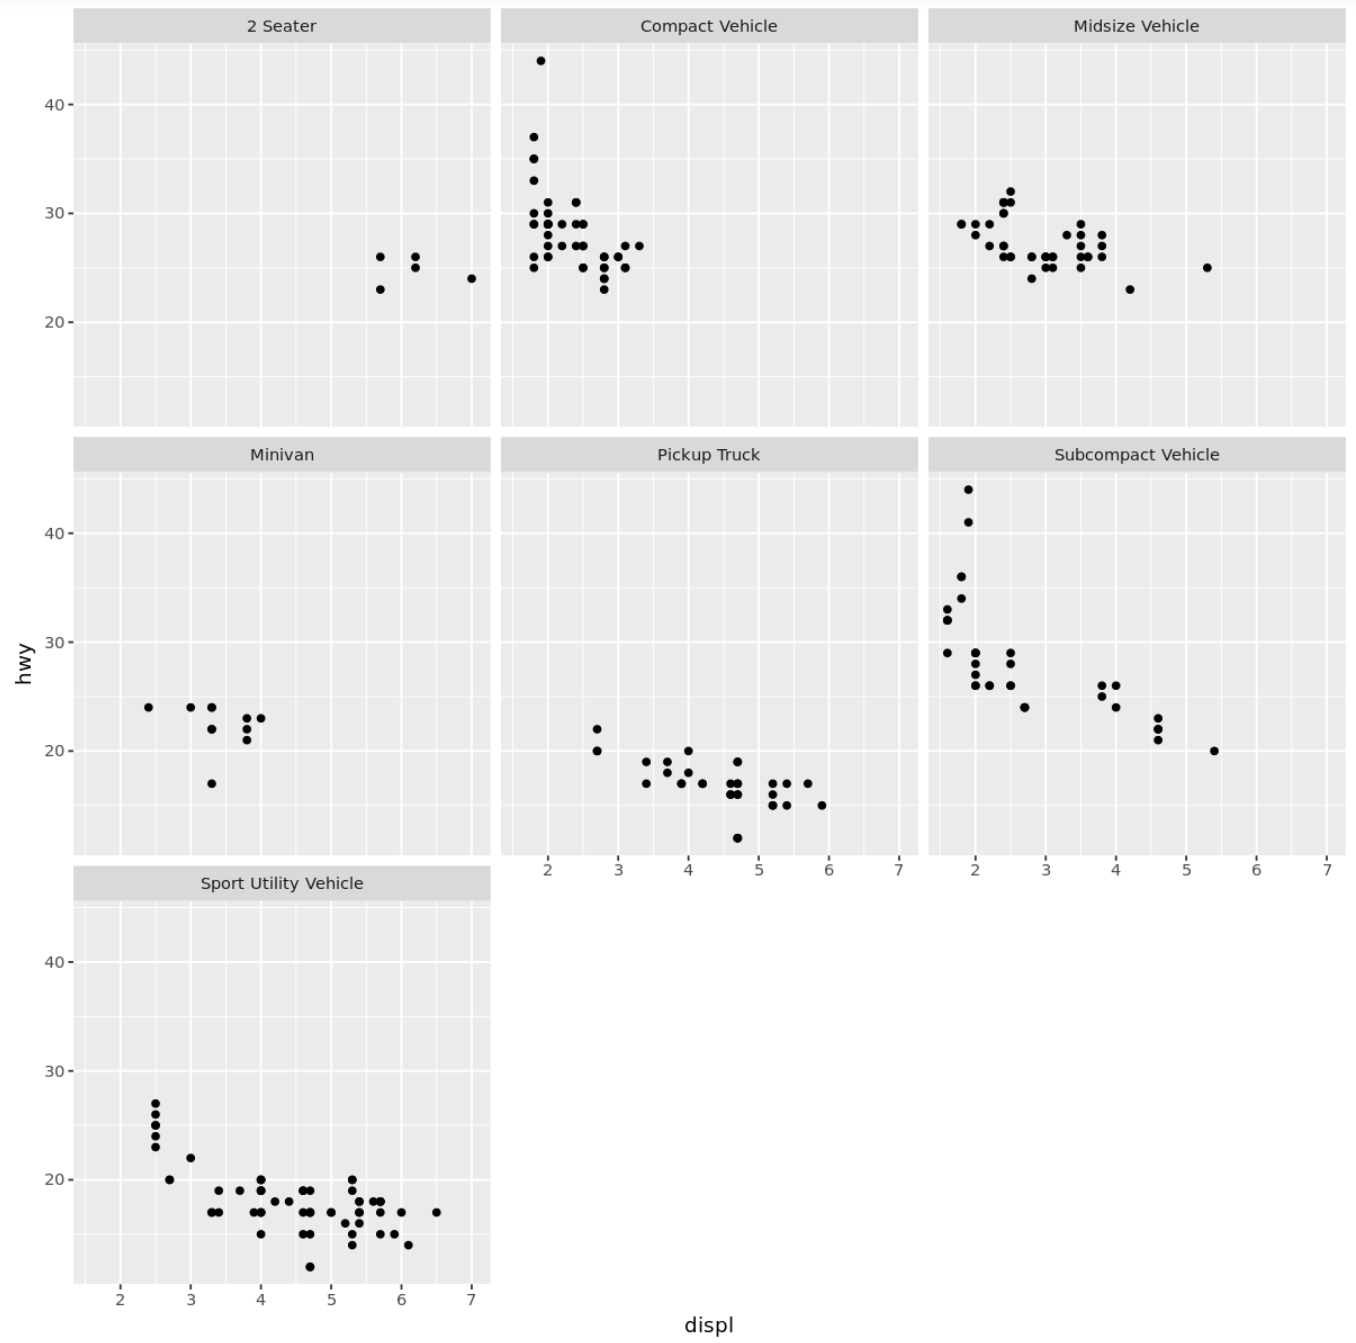
示例 2:使用自定义标签
以下代码演示了如何将facet_wrap()函数与绘图标题的自定义标签一起使用:
 #define custom labels
plot_names <- c('2seater' = "2 Seater",
                'compact' = "Compact Vehicle",
                'midsize' = "Midsize Vehicle",
                'minivan' = "Minivan",
                'pickup' = "Pickup Truck",
                'subcompact' = "Subcompact Vehicle",
                'suv' = "Sport Utility Vehicle")

#use facet_wrap with custom plot labels
ggplot(mpg, aes (displ, hwy)) +
  geom_point() +
  facet_wrap(vars(class), labeller = as_labeller (plot_names))

示例 3:使用自定义比例
以下代码演示了如何使用facet_wrap()函数以及每个单独图的自定义比例:
 #use facet_wrap with custom scales
ggplot(mpg, aes (displ, hwy)) +
  geom_point() +
  facet_wrap(vars(class), scales=' free ')

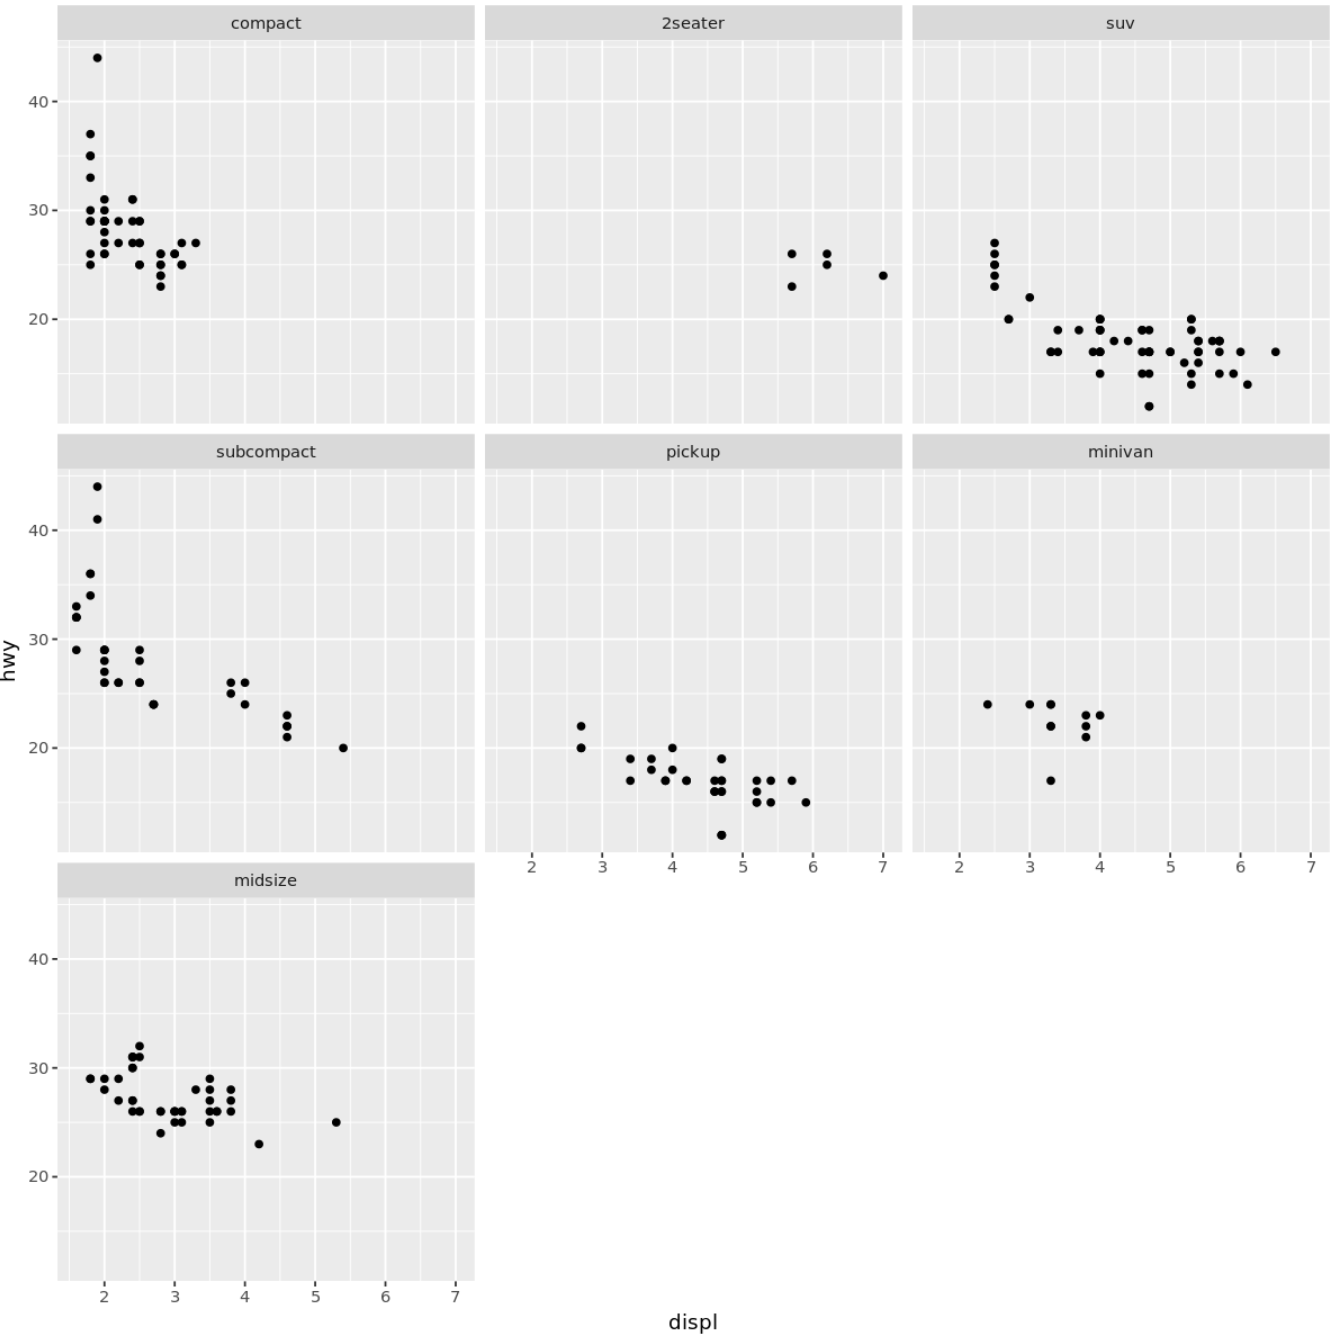
示例 4:使用自定义命令
以下代码展示了如何使用facet_wrap()函数对各个图进行自定义排序:
 #define order for plots
mpg <- within(mpg, class <- factor(class, levels=c(' compact ', ' 2seater ', ' suv ',
                                                   ' subcompact ', ' pickup ',
                                                   ' minivan ', ' midsize ')))

#use facet_wrap with custom order
ggplot(mpg, aes (displ, hwy)) +
  geom_point() +
  facet_wrap(vars(class))

请注意,绘图按照我们指定的确切顺序出现。