如何向 ggplot2 绘图添加文本(带有示例)
您可以使用annotate()函数向 ggplot2 中的绘图添加文本。
该函数使用以下基本语法:
 p+
  annotate(" text ", x= 6 , y= 10 , label= " hello ")
金子:
- x, y :文本应放置的坐标 (x, y)。
- label :要显示的文本。
以下示例展示了如何在实践中使用此功能。
示例 1:向 ggplot2 添加文本元素
以下代码显示如何使用annotate()将文本元素添加到 ggplot2 散点图:
 library (ggplot2)

#create data frame
df <- data. frame (x=c(1, 3, 3, 5, 7, 8, 10, 11),
                 y=c(3, 5, 7, 5, 8, 10, 14, 19))

#create scatter plot with one text element
ggplot(df, aes(x=x, y=y)) +
  geom_point()
  annotate(" text ", x= 6 , y= 10 , label= " hello ")
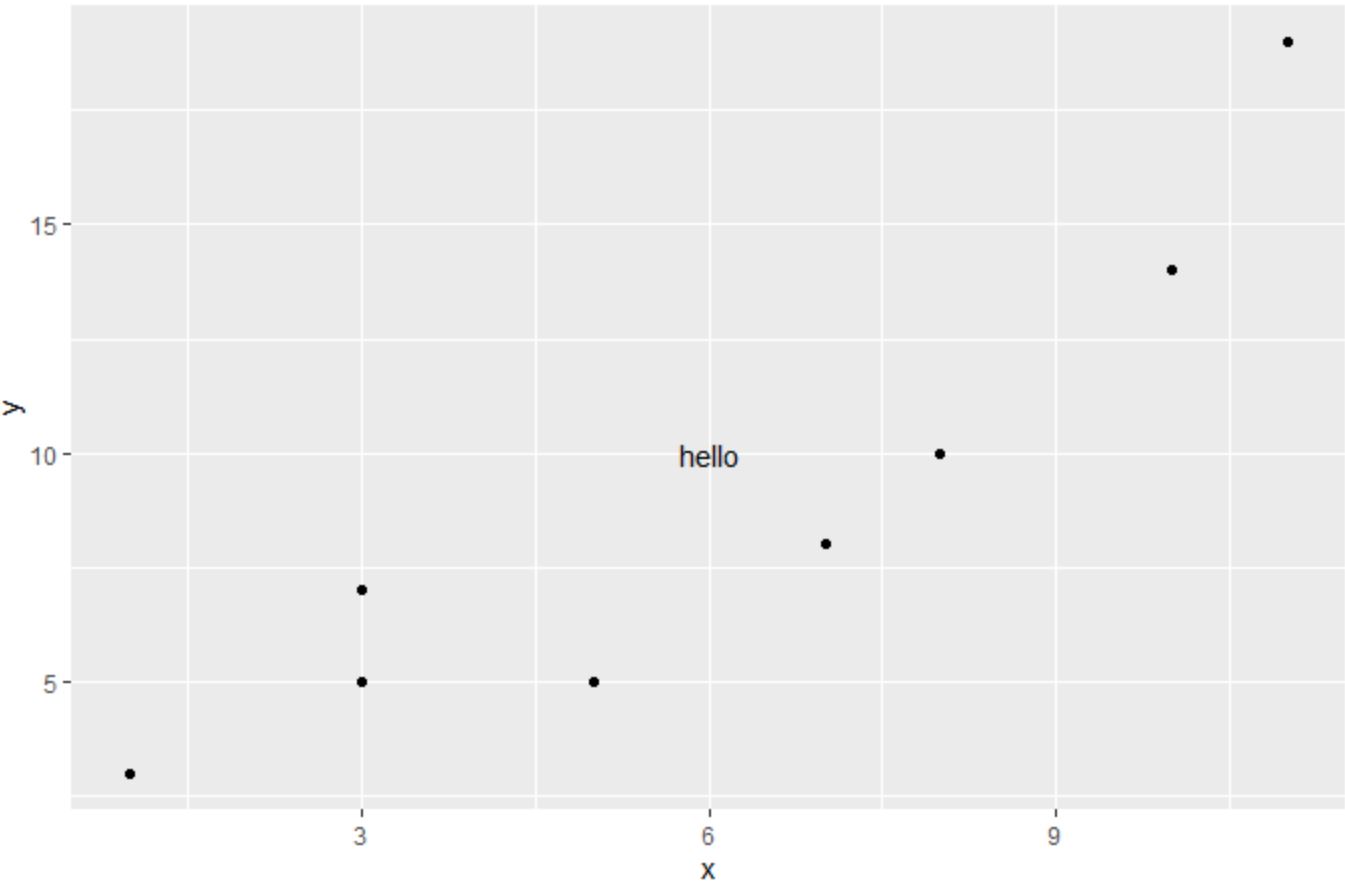
请注意,我们的文本元素已添加到图中 (6, 10) 的 (x, y) 坐标。
示例 2:向 ggplot2 添加多个文本元素
以下代码显示如何使用annotate()将多个文本元素添加到 ggplot2 散点图:
 library (ggplot2)

#create data frame
df <- data. frame (x=c(1, 3, 3, 5, 7, 8, 10, 11),
                 y=c(3, 5, 7, 5, 8, 10, 14, 19))

#create scatter plot with one text element
ggplot(df, aes(x=x, y=y)) +
  geom_point() +
  annotate(" text ", x= 6 , y= 10 , label= " hello ") +
  annotate(" text ", x= 3 , y= 15 , label= " hello again ")
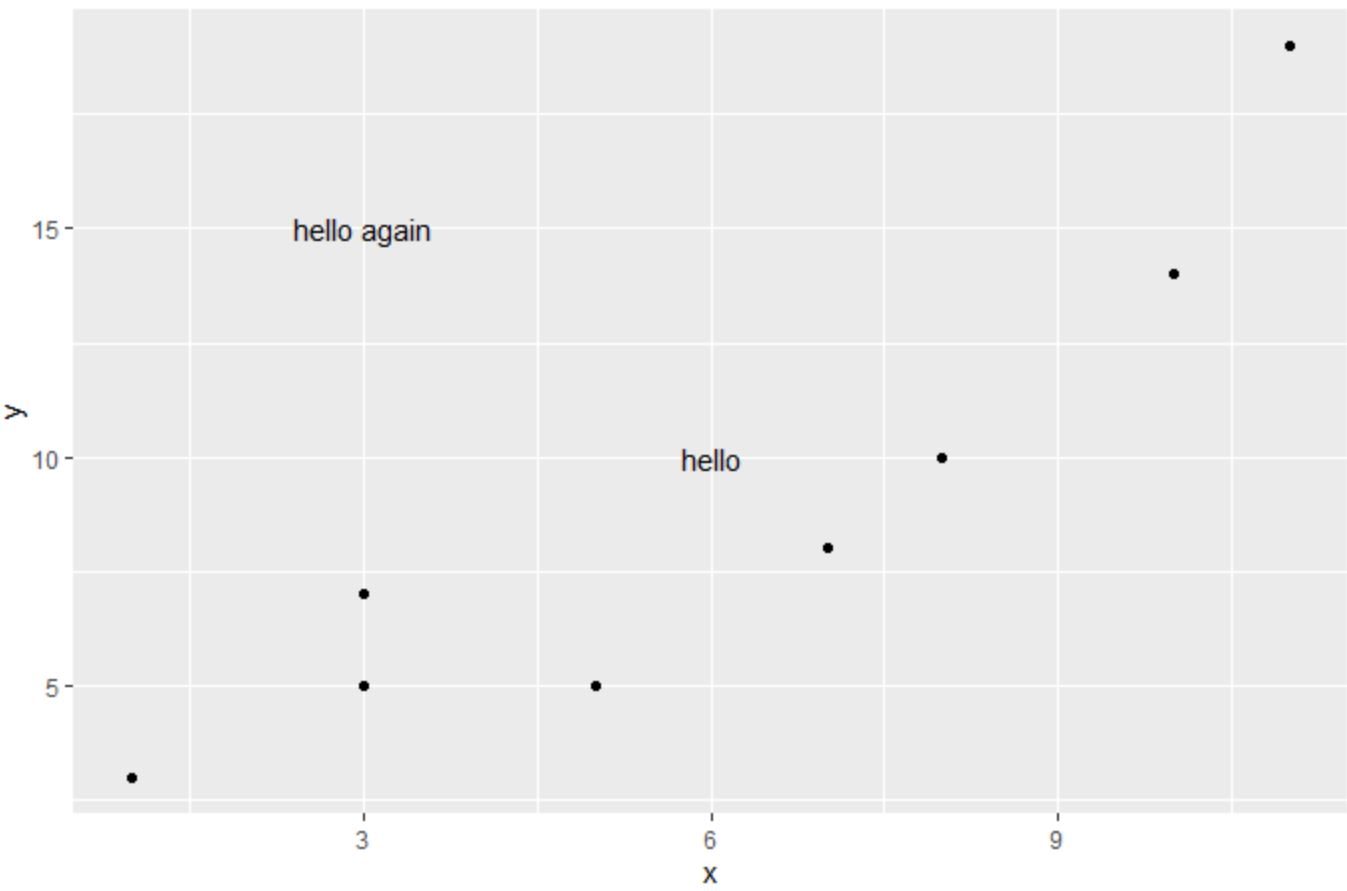
请注意,两个文本元素已添加到绘图中我们指定的坐标处。
示例 3:自定义图中的文本元素
我们可以使用size 、 col和italic或bold参数来分别自定义图中文本元素的大小、颜色和字体样式:
 library (ggplot2)

#create data frame
df <- data. frame (x=c(1, 3, 3, 5, 7, 8, 10, 11),
                 y=c(3, 5, 7, 5, 8, 10, 14, 19))

#create scatter plot with custom text element
ggplot(df, aes(x=x, y=y)) +
  geom_point() +
  annotate(" text ", x= 6 , y= 10 , label= " bolditalic(hello) ",
           col=" blue ", size= 10 , parse= TRUE )
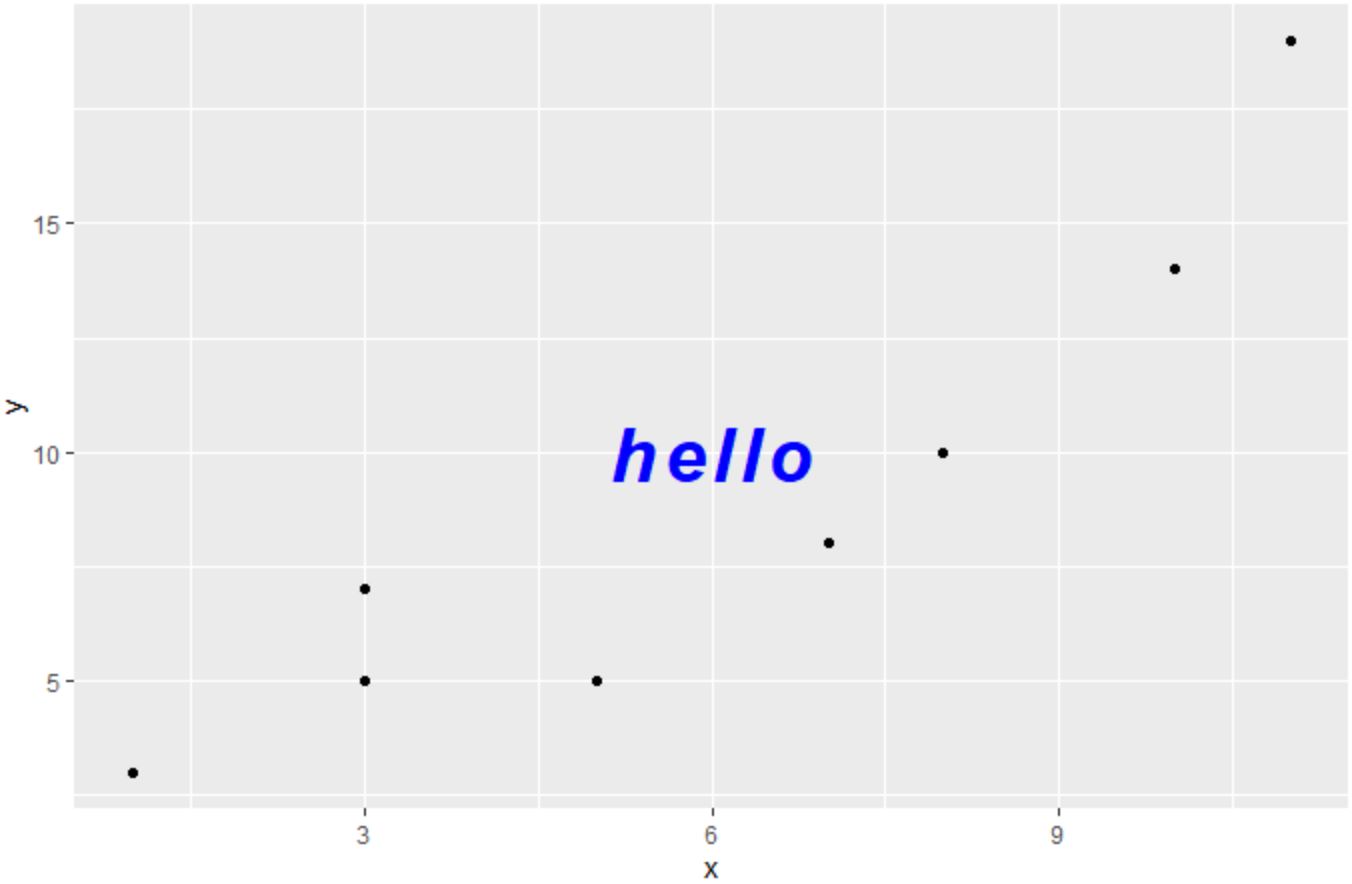
请注意,图中唯一的文本元素现在为粗体、斜体、蓝色,大小为 10。
注意:您可以在此处找到 ggplot2 中annotate()函数的完整文档。
其他资源
以下教程解释了如何在 R 中执行其他常见任务:
如何更改ggplot2中的点大小
如何更改ggplot2中的标题位置
如何删除ggplot2中的轴标签
关于作者
本杰明·安德森博
大家好,我是本杰明,一位退休的统计学教授,后来成为 Statorials 的热心教师。 凭借在统计领域的丰富经验和专业知识,我渴望分享我的知识,通过 Statorials 增强学生的能力。了解更多