如何在 r 中创建核密度图(附示例)
核密度图是一种使用连续曲线显示数据集中值的分布的图。

核密度图与直方图类似,但它更适合显示分布的形状,因为它不受直方图中使用的 bin 数量的影响。
我们可以使用以下方法在 R 中创建核密度图:
方法 1:创建单核密度图
 #define kernel density
kd <- density(data)

#create kernel density plot
plot(kd)
方法 2:创建填充核密度图
 #define kernel density
kd <- density(data)

#create kernel density plot
plot(kd)

#fill in kernel density plot with specific color
polygon(kd, col=' blue ', border=' black ')
方法 3:创建多个核密度图
 #plot first kernel density plot
kd1 <- density(data1)
plot(kd1, col=' blue ')

#plot second kernel density plot
kd2 <- density(data2)
lines(kd2, col=' red ')

#plot third kernel density plot
kd3 <- density(data3)
lines(kd3, col=' purple ')

...
以下示例展示了如何在实践中使用每种方法。
方法 1:创建单核密度图
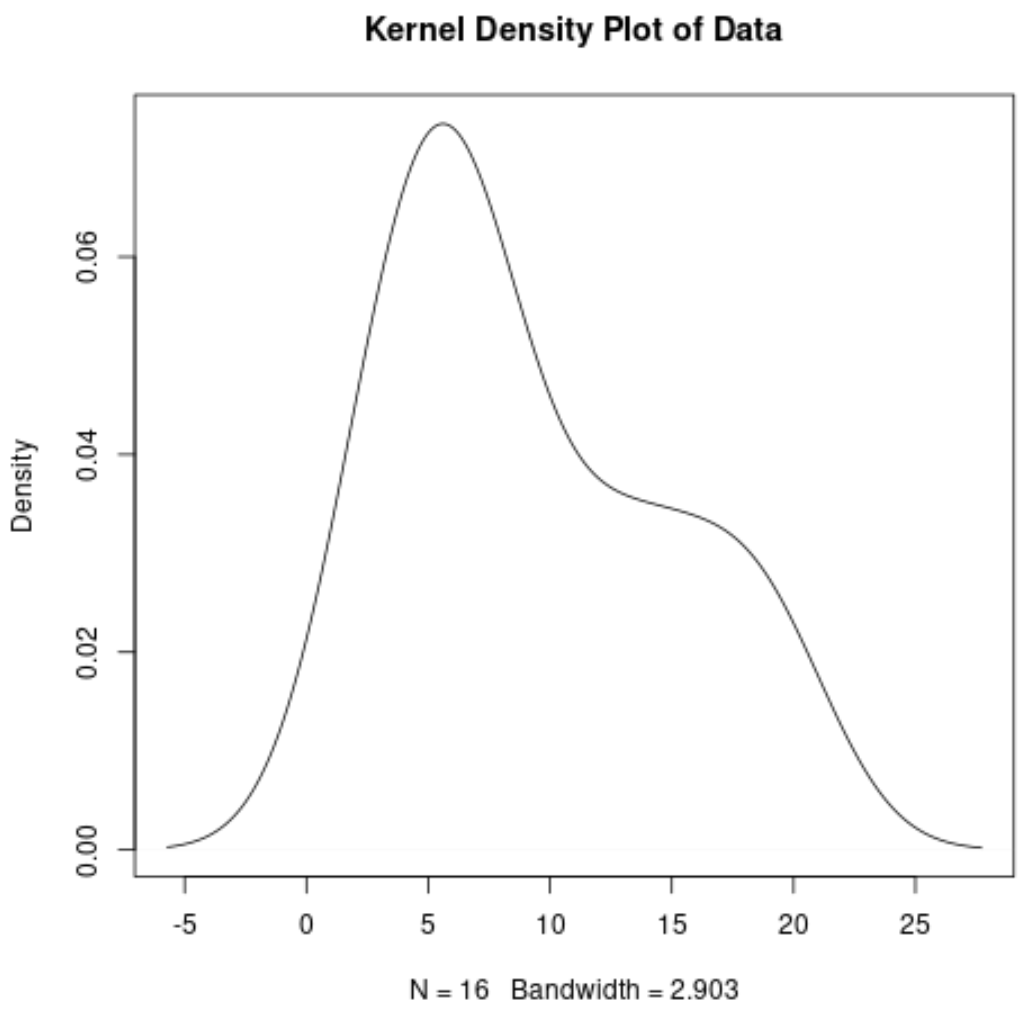
以下代码展示了如何在 R 中为数据集创建核密度图:
 #create data
data <- c(3, 3, 4, 4, 5, 6, 7, 7, 7, 8, 12, 13, 14, 17, 19, 19)

#define kernel density
kd <- density(data)

#create kernel density plot
plot(kd, main=' Kernel Density Plot of Data ')

x 轴显示数据集中的值,y 轴显示每个值的相对频率。图表上的最高点表示值最常出现的位置。
方法 2:创建填充核密度图
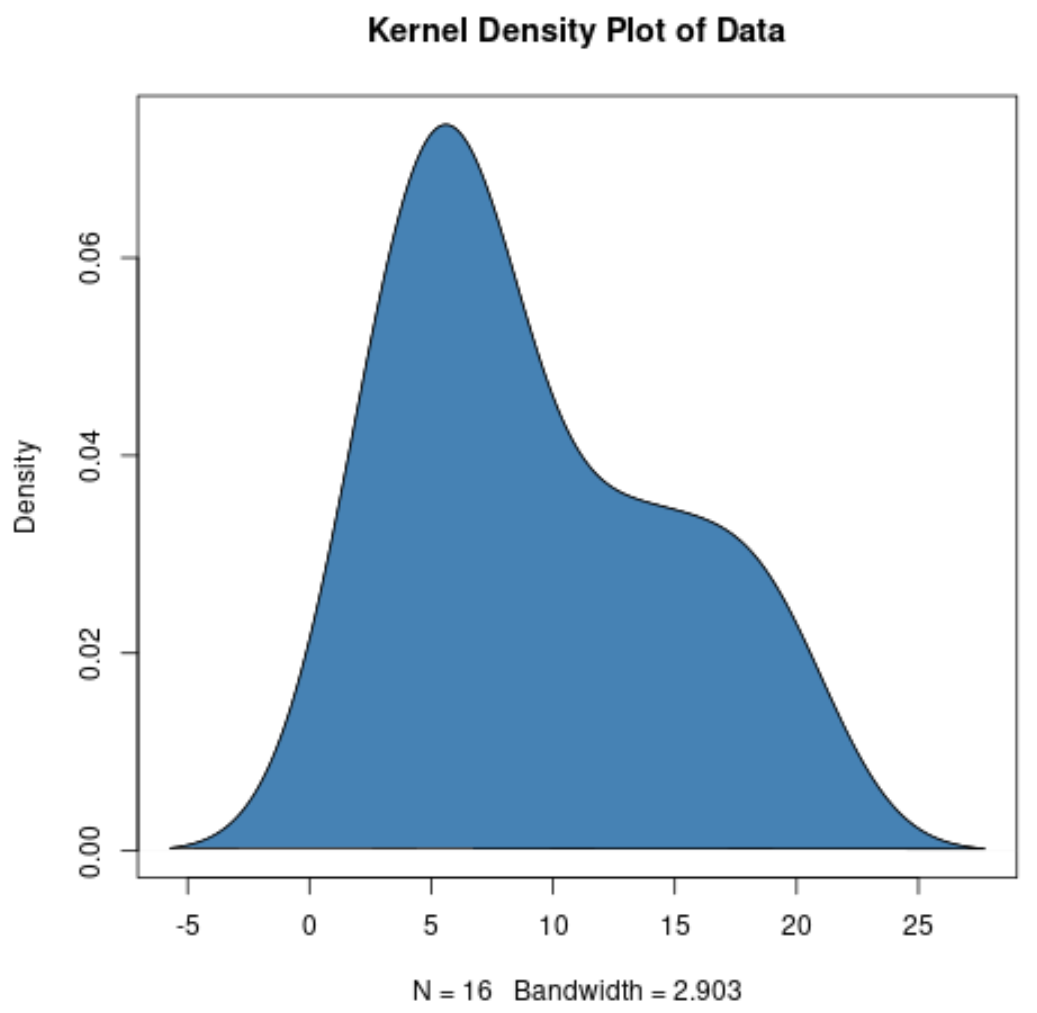
以下代码演示了如何创建具有特定边框颜色和填充颜色的核密度图:
 #create data
data <- c(3, 3, 4, 4, 5, 6, 7, 7, 7, 8, 12, 13, 14, 17, 19, 19)

#define kernel density
kd <- density(data)

#create kernel density plot
plot(kd)

#add color
polygon(kd, col=' steelblue ', border=' black ')

方法 3:创建多个核密度图
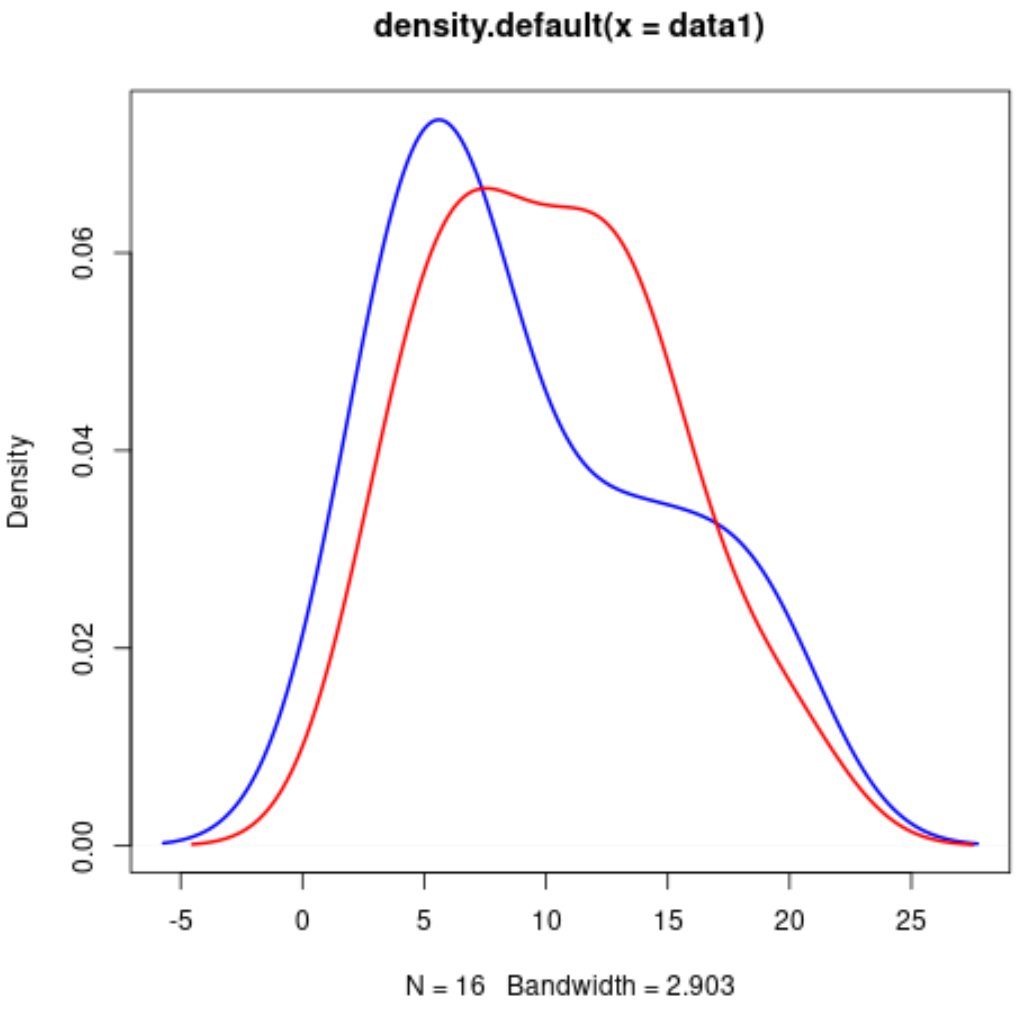
以下代码展示了如何在 R 中的单个图中创建多个核密度图:
 #create datasets
data1 <- c(3, 3, 4, 4, 5, 6, 7, 7, 7, 8, 12, 13, 14, 17, 19, 19)
data2 <- c(12, 3, 14, 14, 4, 5, 6, 10, 14, 7, 7, 8, 10, 12, 17, 20)

#plot first kernel density plot
kd1 <- density(data1)
plot(kd1, col=' blue ', lwd= 2 )

#plot second kernel density plot
kd2 <- density(data2)
lines(kd2, col=' red ', lwd= 2 )

请注意,我们可以使用类似的语法在单个图中创建任意数量的核密度图。
其他资源
以下教程解释了如何在 R 中创建其他常见绘图: