如何在单个图中创建多个 seaborn 绘图
您可以使用FacetGrid()函数在单个图中创建多个 Seaborn 绘图:
 #definegrid
g = sns. FacetGrid (data=df, col=' variable1 ', col_wrap= 2 )

#add plots to grid
g. map ( sns.scatterplot , ' variable2 ', ' variable3 ')
请注意, col参数指定要换行的变量, col_wrap参数指定每行显示的绘图数。
以下示例展示了如何在实践中通过内置“tips”数据集使用此函数:
 #load tips dataset
tips = sns. load_dataset (' tips ')

#view first five rows of tips dataset
tips. head ()

   total_bill tip sex smoker day time size
0 16.99 1.01 Female No Sun Dinner 2
1 10.34 1.66 Male No Sun Dinner 3
2 21.01 3.50 Male No Sun Dinner 3
3 23.68 3.31 Male No Sun Dinner 2
4 24.59 3.61 Female No Sun Dinner 4
示例 1:创建多个路径
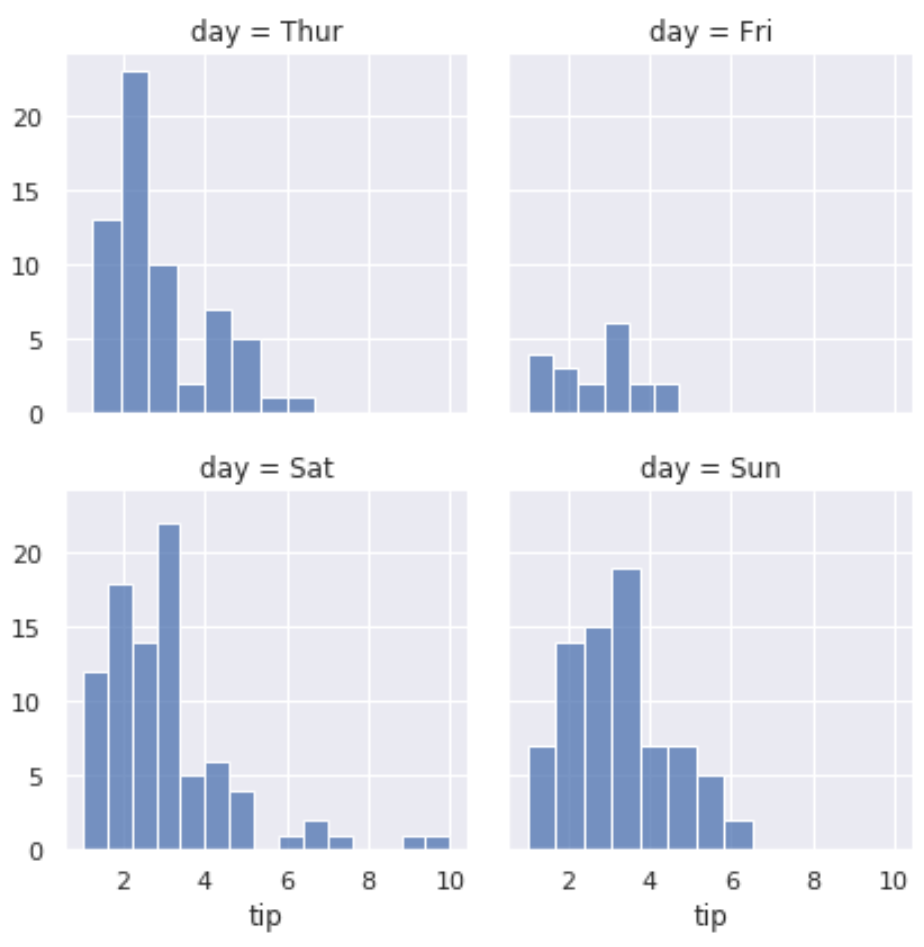
以下代码显示了如何在单个图中创建多个 Seaborn 图:
 #define grid with two plots per row
g = sns. FacetGrid (data=tips, col=' day ', col_wrap= 2 )

#add histograms to each plot
g. map (sns. histplot , ' tip ')

这是我们用这个简单的代码所做的:
- 指定按变量“day”分组
- 指定每行显示 2 个图
- 指定在每个图中显示一个直方图,显示每个特定日期的“tip”值的分布
示例 2:创建多条具有特定高度的路径
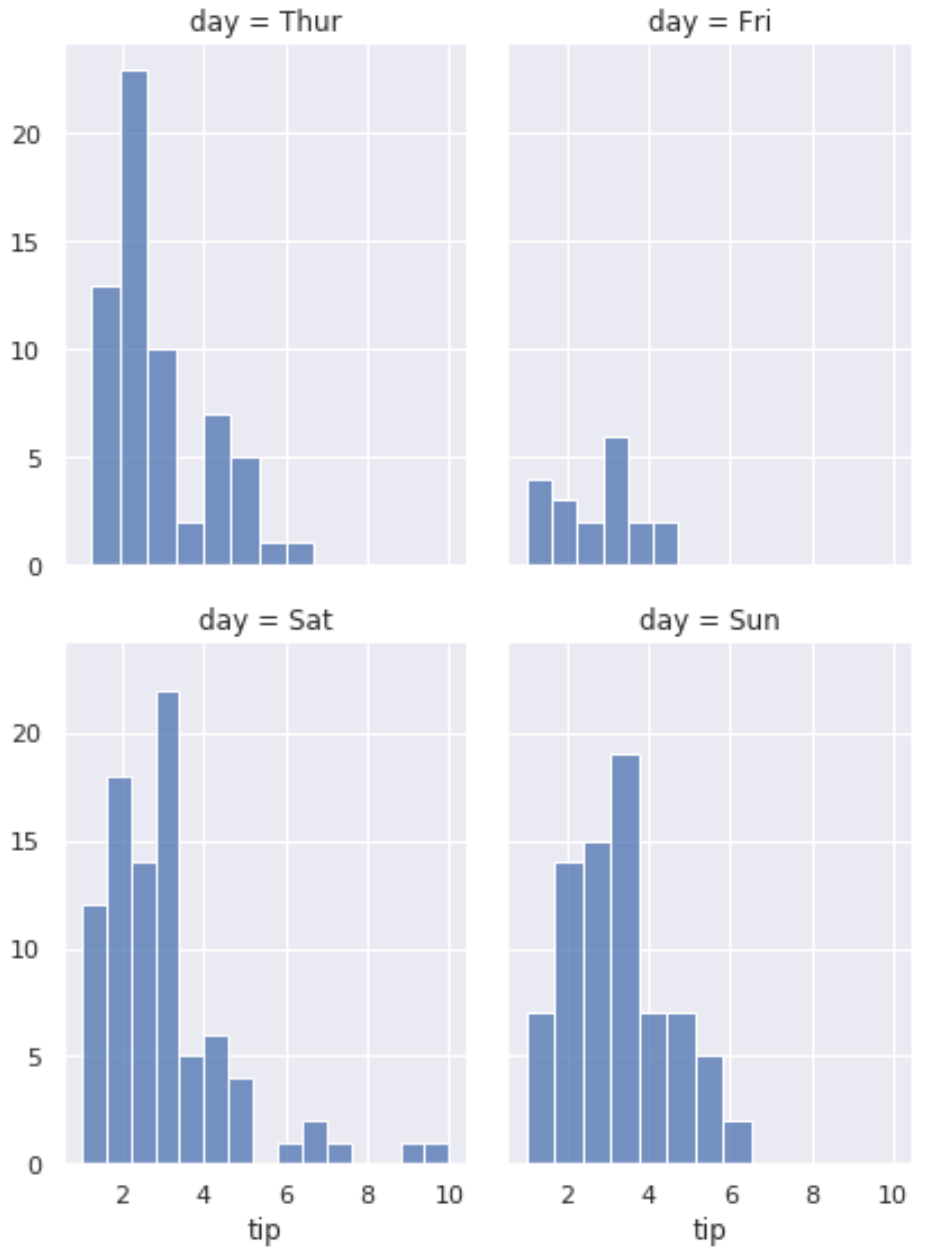
以下代码展示了如何创建具有特定高度和纵横比的多个 Seaborn 绘图:
 #definegrid
g = sns. FacetGrid (data=tips, col=' day ', col_wrap= 2 , height= 4 , aspect= .75 )

#add histograms to each plot
g. map (sns. histplot , ' tip ')

示例 3:使用图例创建多个图
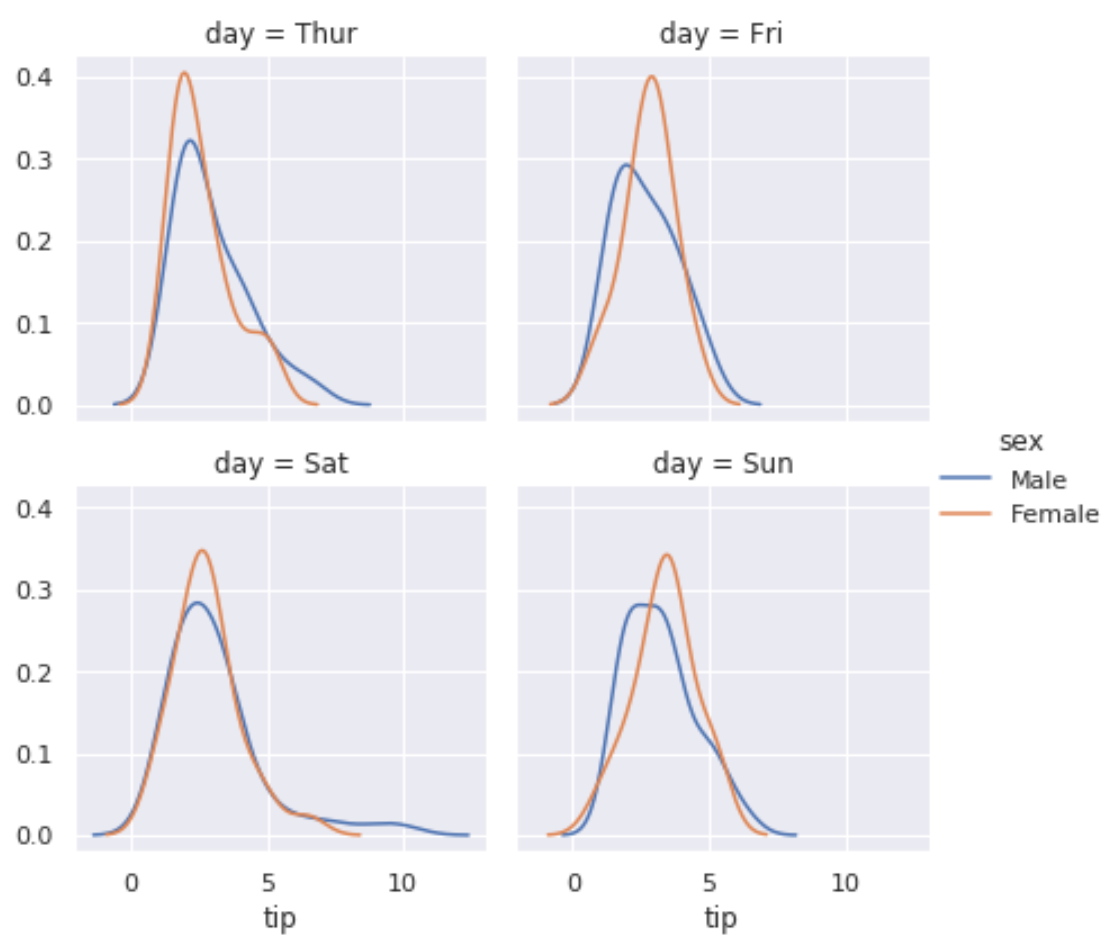
以下代码显示了如何创建多个 Seaborn 绘图并添加图例:
 #definegrid
g = sns. FacetGrid (data=tips, col=' day ', hue=' sex ', col_wrap= 2 )

#add density plots to each plot
g. map ( sns.kdeplot , ' tip ')

#add legend
g. add_legend ()
