如何在 ggplot2 中添加表格到图中(2 个示例)
通常,您可能希望将表格添加到 R 中 ggplot2 创建的绘图中,以便读者可以将原始数据与绘图一起可视化。
幸运的是,使用 ggpmisc 包将表格添加到图中很容易:
 install. packages (' ggpmisc ')
library (ggpmisc)
以下示例展示了如何使用此包将表添加到使用以下数据框的条形图和散点图:
 #create data frame
df <- data. frame (team=c('A', 'A', 'A', 'A', 'B', 'B', 'B', 'B'),
                 position=c('G', 'G', 'F', 'F', 'G', 'G', 'F', 'F'),
                 points=c(13, 23, 24, 20, 19, 14, 29, 31))

#view data frame
df

  team position points
1 AG 13
2 AG 23
3 AF 24
4 AF 20
5 BG 19
6 BG 14
7 BF 29
8 BF 31
示例 1:在 ggplot2 中向 Barplot 添加表格
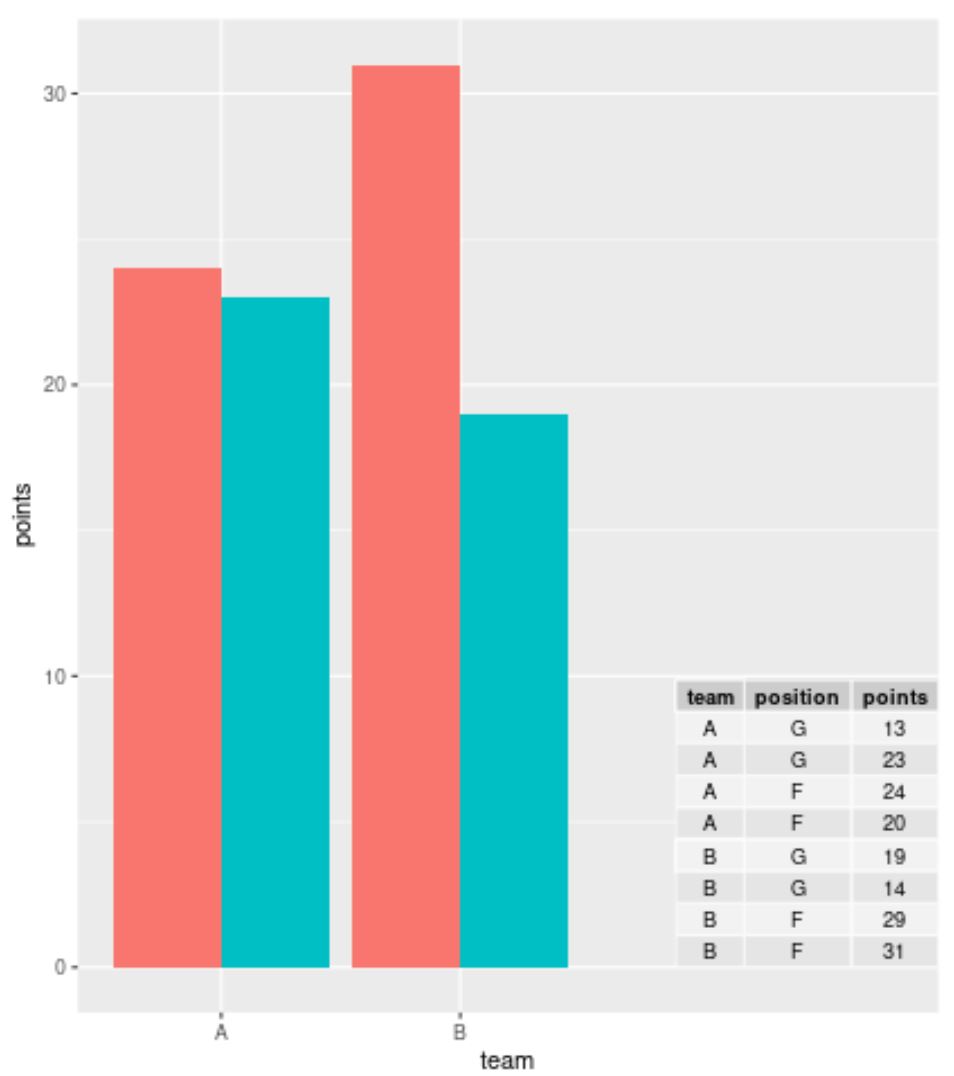
我们可以使用以下代码在ggplot2中创建分组条形图,并在图的右下角添加一个表格来显示数据框的实际值:
 library (ggplo2)
library (ggpmisc)

#create barplot with table
ggplot(df, aes(x=team, y=points, fill=position)) +
    geom_bar(position=' dodge ', stat=' identity ') +
    annotate(geom = ' table ',
           x=4,
           y=0,
           label=list(df))

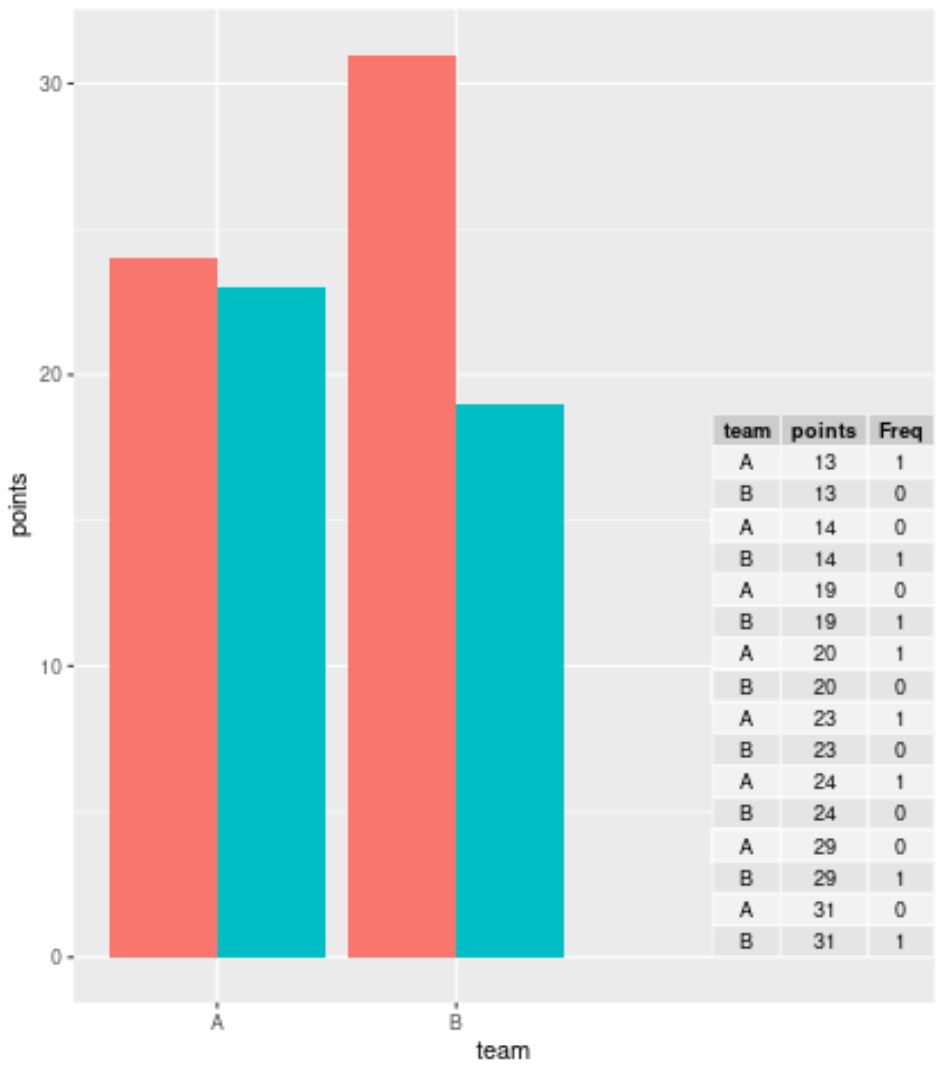
如果您正在使用大型数据集并且不想显示每一行,则可以在 ggplot2 中创建表之前使用table()函数来汇总数据:
 library (ggplot2)
library (ggpmisc)

#summarize frequencies of team and points in table
my_table <- as. data . frame (table(df[, c(1, 3)]))

#create barplot with table
ggplot(df, aes(x=team, y=points, fill=position)) +
    geom_bar(position=' dodge ', stat=' identity ') +
    annotate(geom = ' table ',
           x=4,
           y=0,
           label=list(my_table))

示例2:向ggplot2中的散点图添加表格
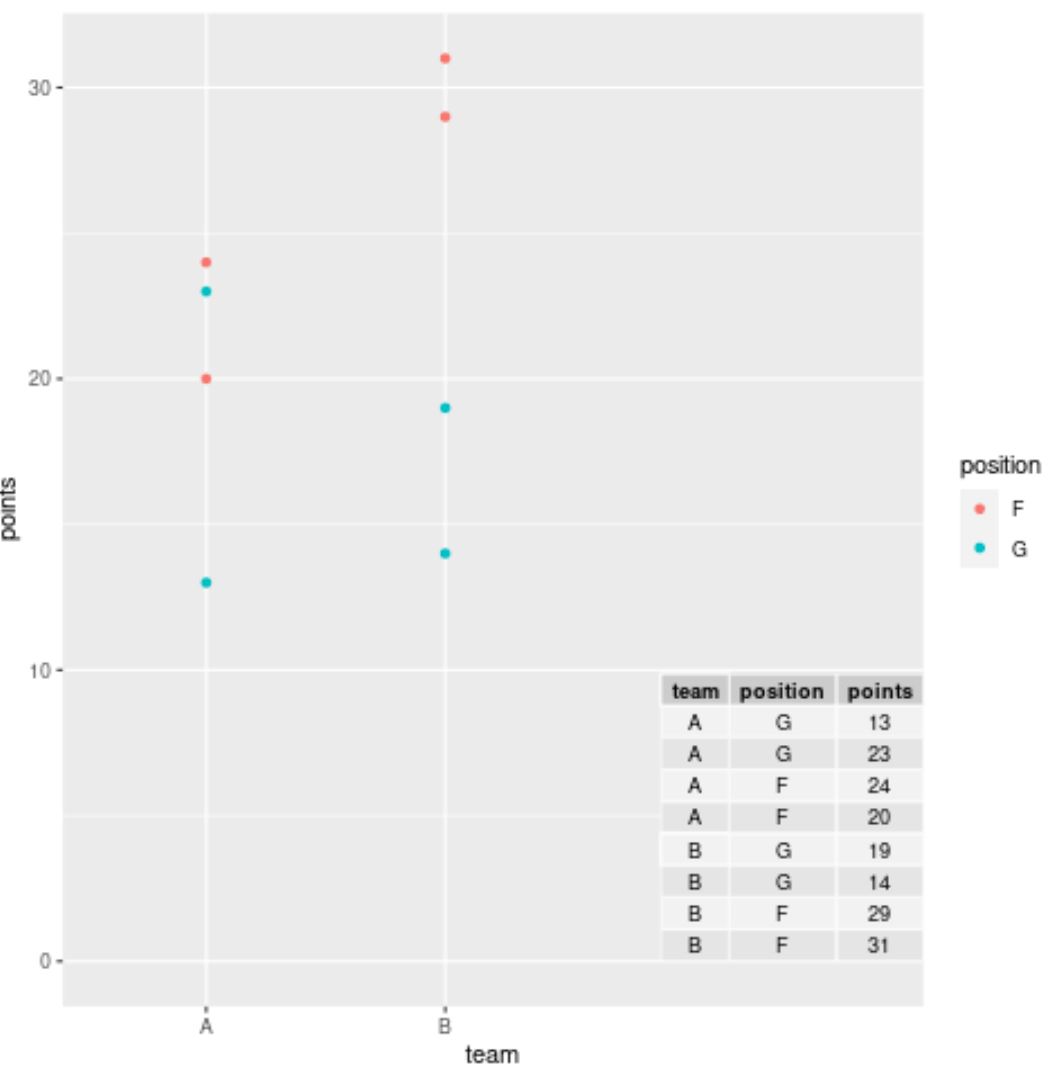
我们可以使用以下代码在ggplot2中创建散点图,并在图的右下角添加一个表格来显示数据框中的实际值:
 library (ggplo2)
library (ggpmisc)

#create scatterplot with table
ggplot(df, aes(x=team, y=points)) +
    geom_point(aes(color=position)) +
    annotate(geom=' table ',
           x=4,
           y=0,
           label=list(df))

注意:随意使用annotate()函数中的x和y值,将数组放置在您想要的确切位置。
其他资源
以下教程解释了如何在 ggplot2 中执行其他常见任务: