如何在matplotlib中设置x轴值
您可以使用以下语法在 Matplotlib 中设置绘图的 X 轴值:
 #specify x-axis locations
x_ticks = [2, 4, 6, 8, 10]

#specify x-axis labels
x_labels = ['A', 'B', 'C', 'D', 'E']

#add x-axis values to plot
plt. xticks (ticks=x_ticks, labels=x_labels)
以下示例展示了如何在实践中使用此语法。
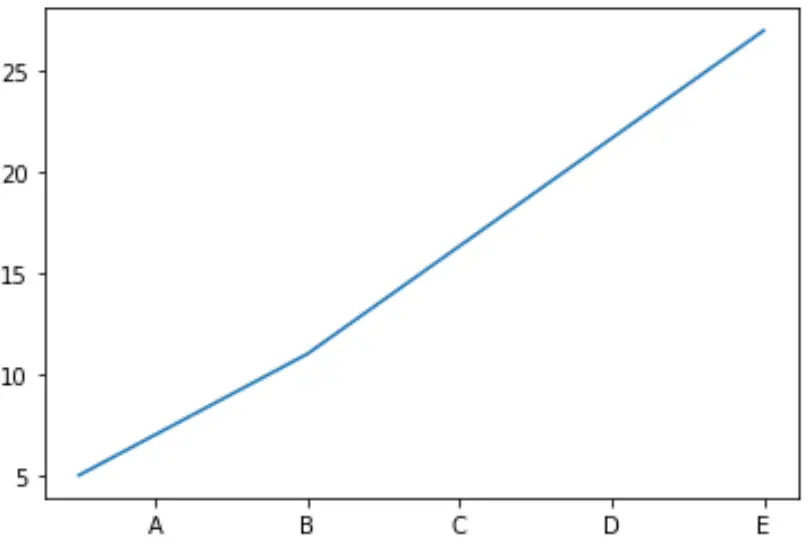
示例1:等间隔设置X轴值
下面的代码展示了如何在Matplotlib中设置等间隔的X轴值:
 import matplotlib. pyplot as plt

#define x and y
x = [1, 4, 10]
y = [5, 11, 27]

#create plot of x and y
plt. plot (x, y)

#specify x-axis locations
x_ticks = [2, 4, 6, 8, 10]

#specify x-axis labels
x_labels = ['A', 'B', 'C', 'D', 'E']

#add x-axis values to plot
plt. xticks (ticks=x_ticks, labels=x_labels)

请注意,每个 X 轴值以等距间隔出现。
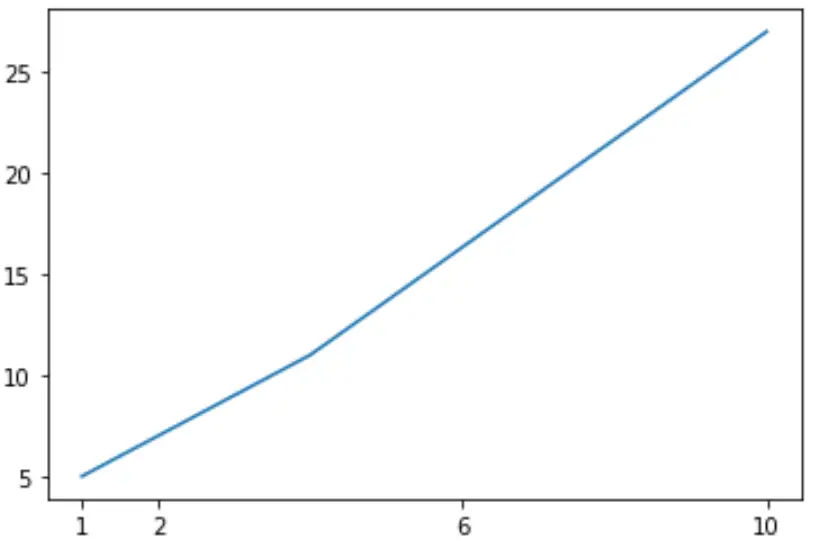
示例2:以不等间隔设置X轴值
下面的代码展示了如何在Matplotlib中设置不等间隔的X轴值:
 import matplotlib. pyplot as plt

#define x and y
x = [1, 4, 10]
y = [5, 11, 27]

#create plot of x and y
plt. plot (x, y)

#specify x-axis locations
x_ticks = [1, 2, 6, 10]

#specify x-axis labels
x_labels = [1, 2, 6, 10]

#add x-axis values to plot
plt. xticks (ticks=x_ticks, labels=x_labels)

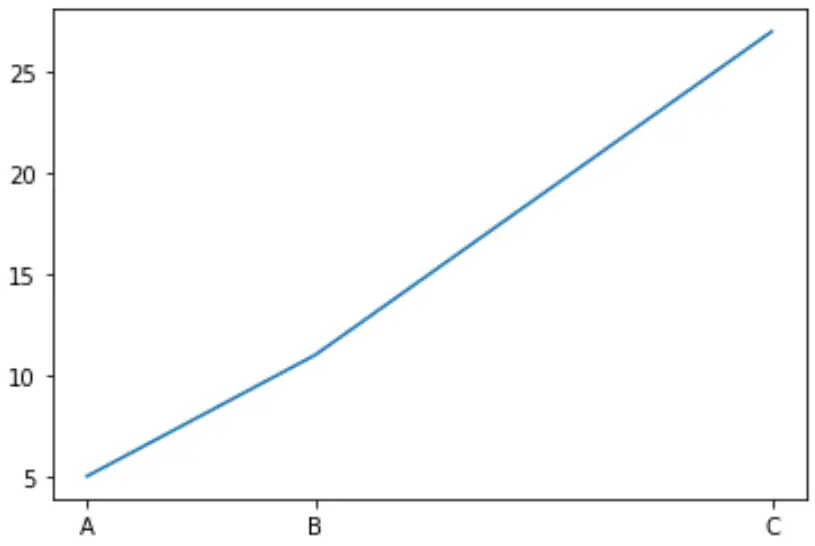
示例 3:仅将 X 轴值设置为数据点
以下代码展示了如何仅在数据点设置X轴值:
 import matplotlib. pyplot as plt

#define x and y
x = [1, 4, 10]
y = [5, 11, 27]

#create plot of x and y
plt. plot (x, y)

#specify x-axis labels
x_labels = ['A', 'B', 'C']

#add x-axis values to plot
plt. xticks (ticks=x, labels=x_labels)
注意:您可以在此处找到plt.xticks()函数的完整文档。
其他资源
如何在 Matplotlib 中设置轴范围
如何在 Matplotlib 中设置复选标记标签的字体大小
如何在单个图形上创建多个 Matplotlib 图
