如何在ggplot2中设置轴限制
通常,您可能想使用ggplot2在绘图上设置轴限制。您可以使用以下函数轻松完成此操作:
- xlim() :指定 x 轴的下限和上限。
- ylim():指定y轴的下限和上限。
请注意,这两种方法都会删除超出范围的数据,这有时会产生意想不到的后果。要更改轴边界而不删除数据观测值,可以使用 coord_cartesian():
- coord_cartesian():指定 x 轴和 y 轴边界,而不删除观测值。
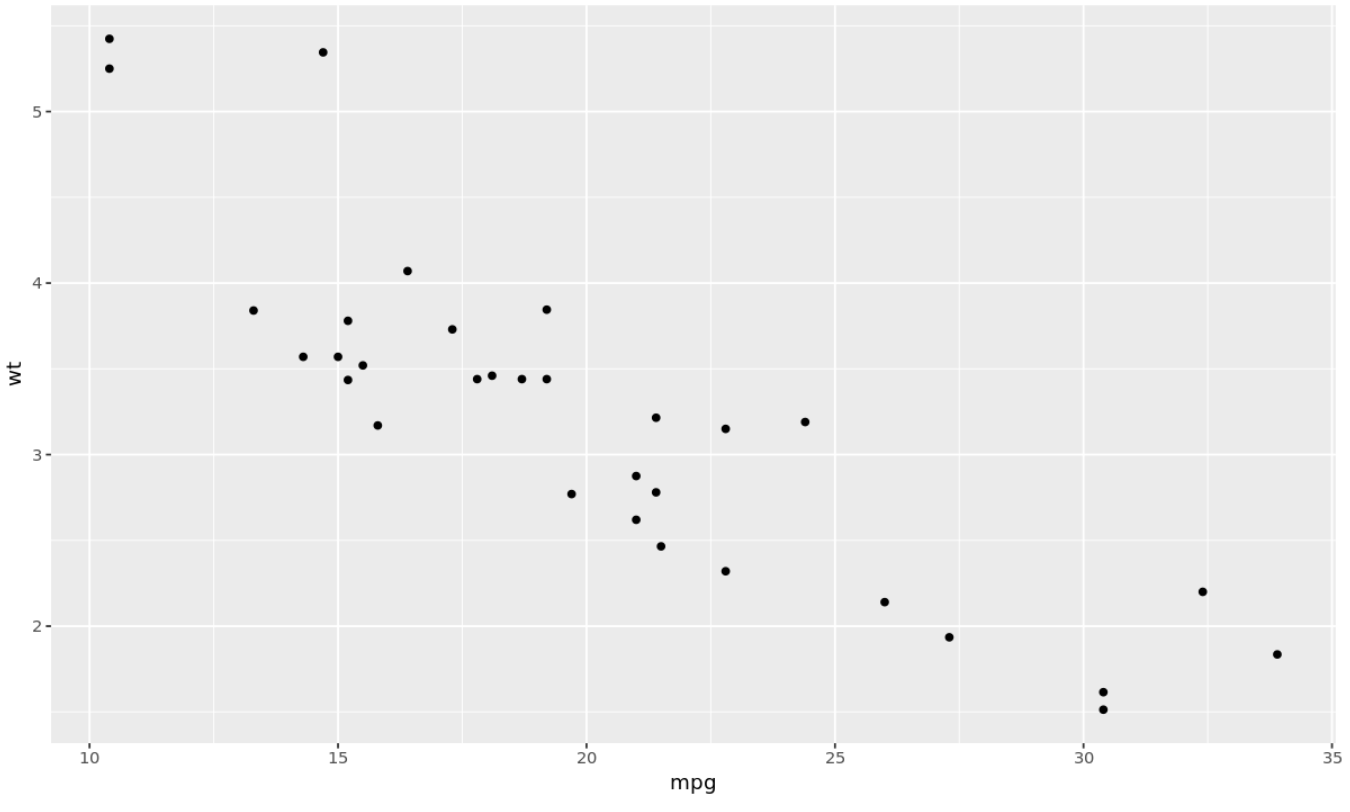
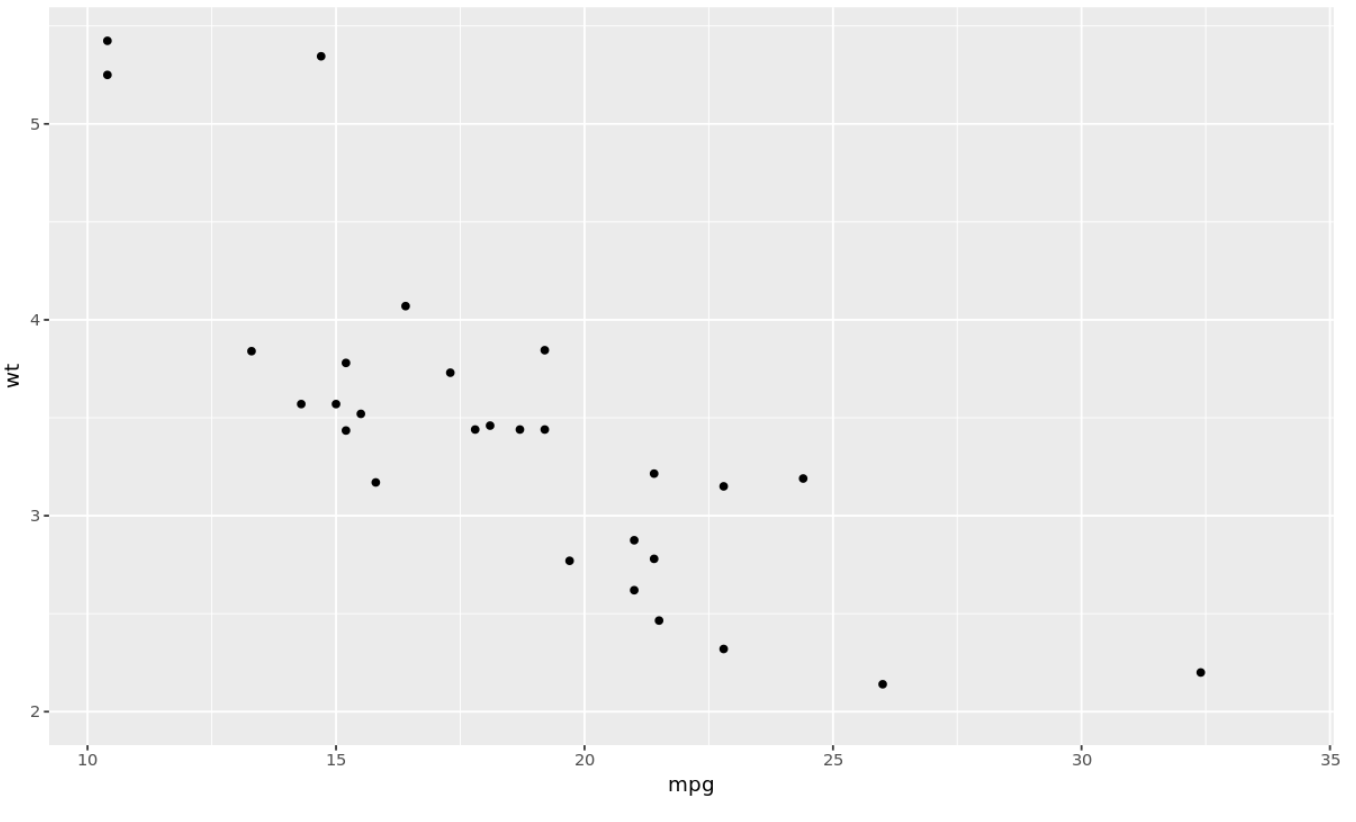
本教程使用mtcars嵌入 R 数据集制作的以下散点图解释了使用这些函数的几种方法:
 #load ggplot2
library(ggplot2)

#create scatterplot
ggplot(mtcars, aes(mpg, wt)) +
  geom_point()
示例 1:使用 xlim() 设置 X 轴限制
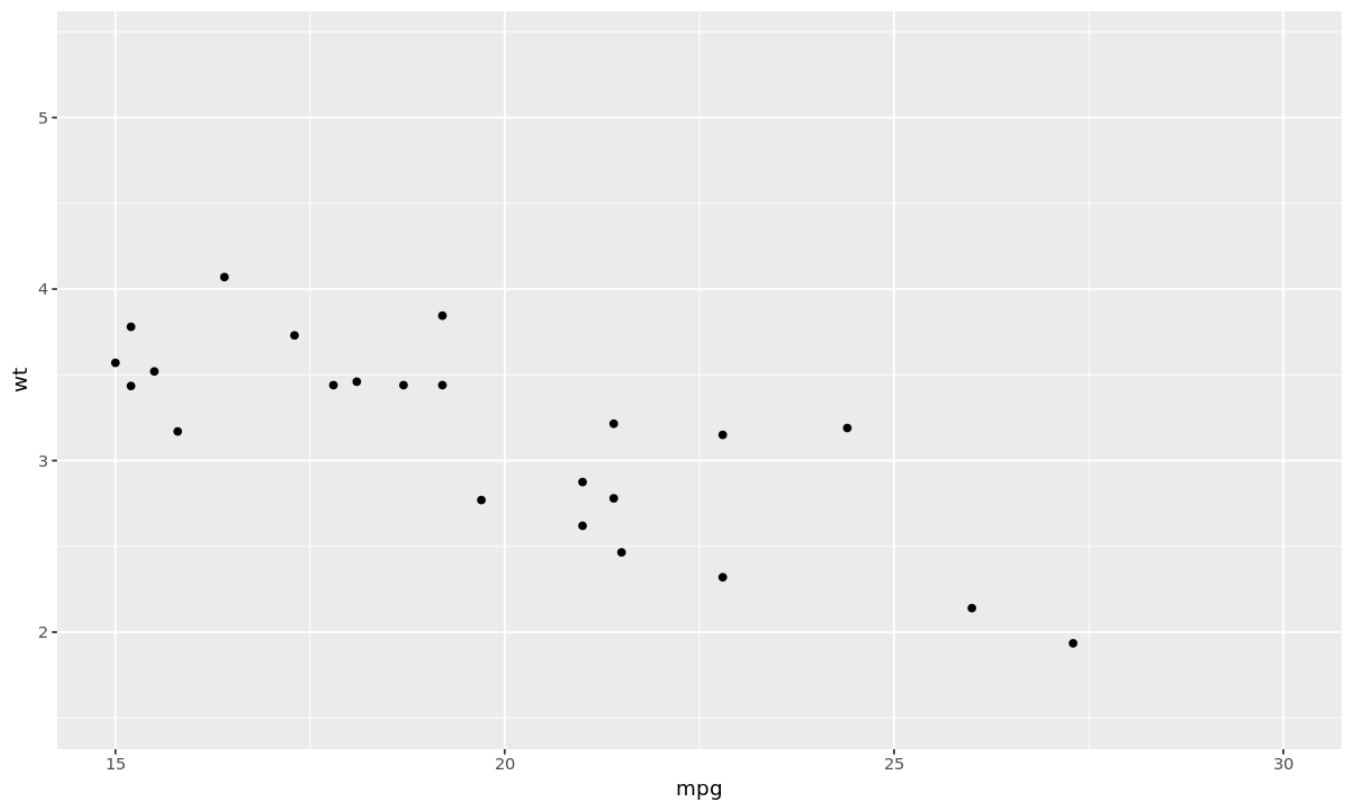
以下代码显示如何使用xlim()函数设置散点图 X 轴的限制:
 #create scatterplot with x-axis ranging from 15 to 30
ggplot(mtcars, aes(mpg, wt)) +
  geom_point() +
  xlim (15, 30)

Warning message:
“Removed 9 rows containing missing values (geom_point).”
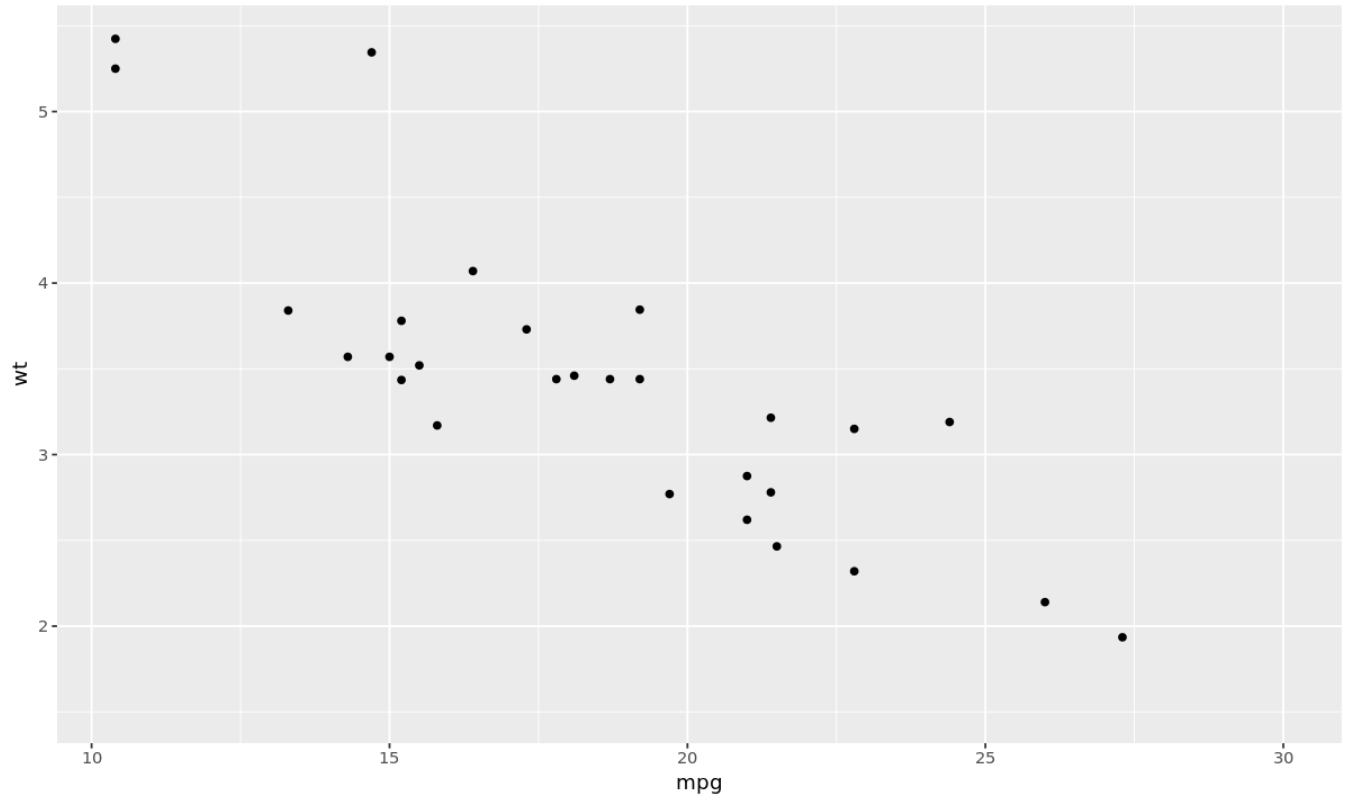
您还可以使用NA仅设置 x 轴的上限,并让 ggplot2 自动选择下限:
 #create scatterplot with x-axis upper limit at 30
ggplot(mtcars, aes(mpg, wt)) +
  geom_point() +
  xlim ( NA , 30)

Warning message:
“Removed 4 rows containing missing values (geom_point).”
示例 2:使用 ylim() 设置 Y 轴限制
以下代码显示如何使用ylim()函数设置散点图 y 轴的边界:
 #create scatterplot with y-axis ranging from 2 to 4
ggplot(mtcars, aes(mpg, wt)) +
  geom_point() +
  ylim (2, 4)

Warning message:
“Removed 8 rows containing missing values (geom_point).”
您还可以使用NA仅设置 y 轴的下限,并让 ggplot2 自动选择上限:
 #create scatterplot with y-axis lower limit at 2
ggplot(mtcars, aes(mpg, wt)) +
  geom_point() +
  xlim (2, NA )

Warning message:
“Removed 4 rows containing missing values (geom_point).”
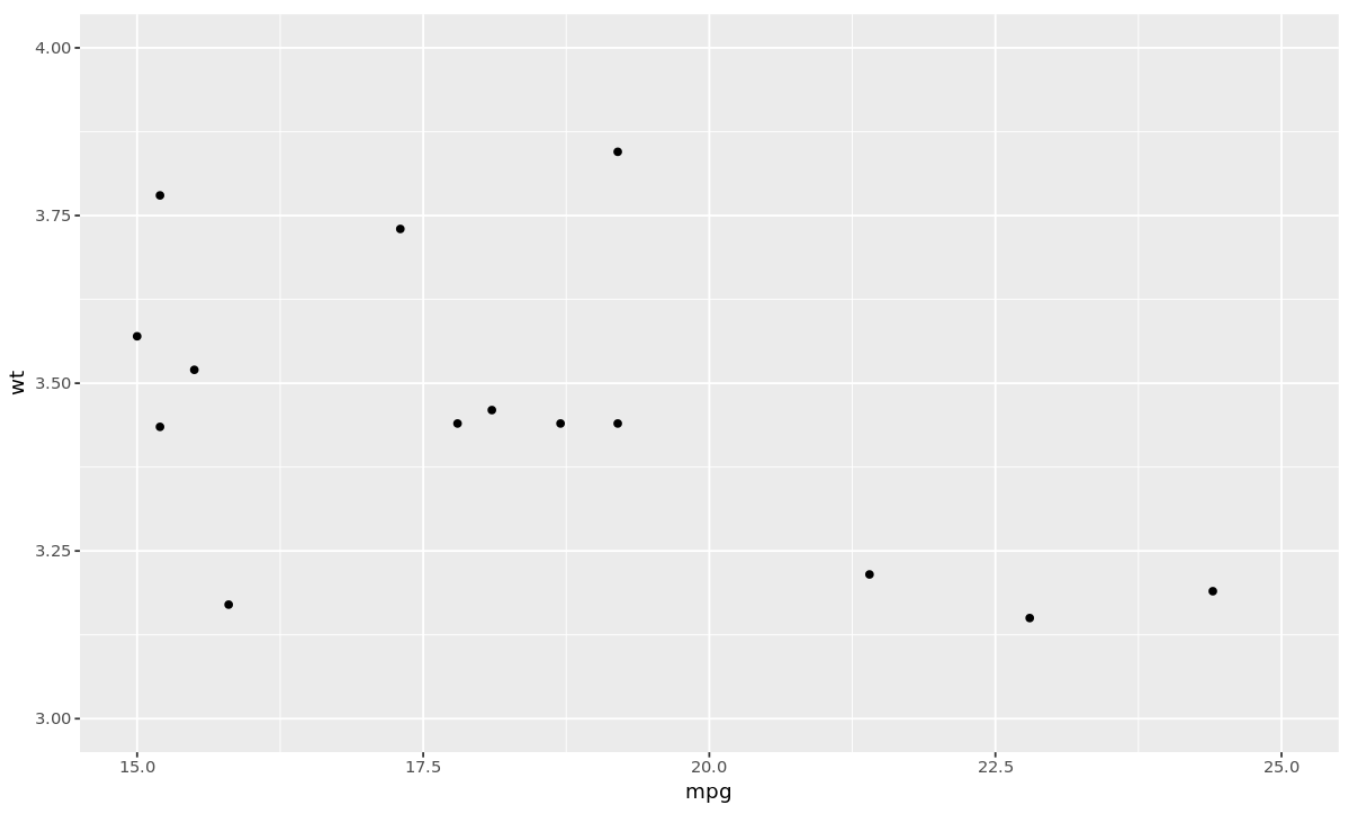
示例 3:使用坐标_cartesian() 设置轴限制
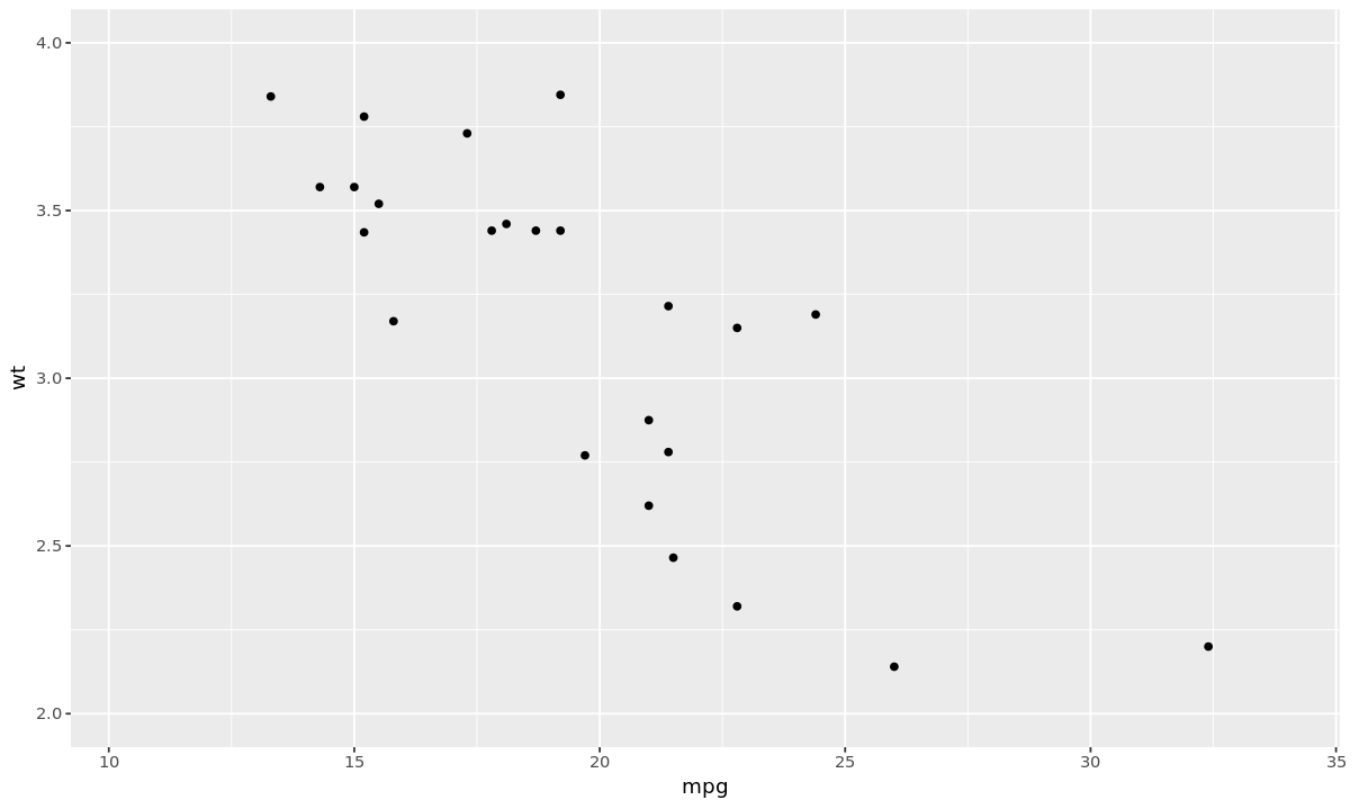
以下代码显示如何使用coord_cartesian()函数设置散点图 y 轴的边界:
 #create scatterplot with y-axis ranging from 2 to 4
ggplot(mtcars, aes(mpg, wt)) +
  geom_point() +
  coord_cartesian(xlim =c (15, 25) , ylim = c (3, 4) )
您可以在这里找到更多 ggplot2 教程。
关于作者
本杰明·安德森博
大家好,我是本杰明,一位退休的统计学教授,后来成为 Statorials 的热心教师。 凭借在统计领域的丰富经验和专业知识,我渴望分享我的知识,通过 Statorials 增强学生的能力。了解更多