如何更改 ggplot2 中的图例大小(带有示例)
您可以使用以下语法更改 ggplot2 图例中元素的大小:
 ggplot(data, aes (x=x, y=y)) +
  theme( legend.key.size = unit(1, ' cm '), #change legend key size
legend.key.height = unit(1, ' cm '), #change legend key height
        legend.key.width = unit(1, ' cm '), #change legend key width
legend.title = element_text(size=14), #change legend title font size
        legend.text = element_text(size=10)) #change legend text font size
以下示例展示了如何在实践中使用这些参数。
更改ggplot2图例键大小
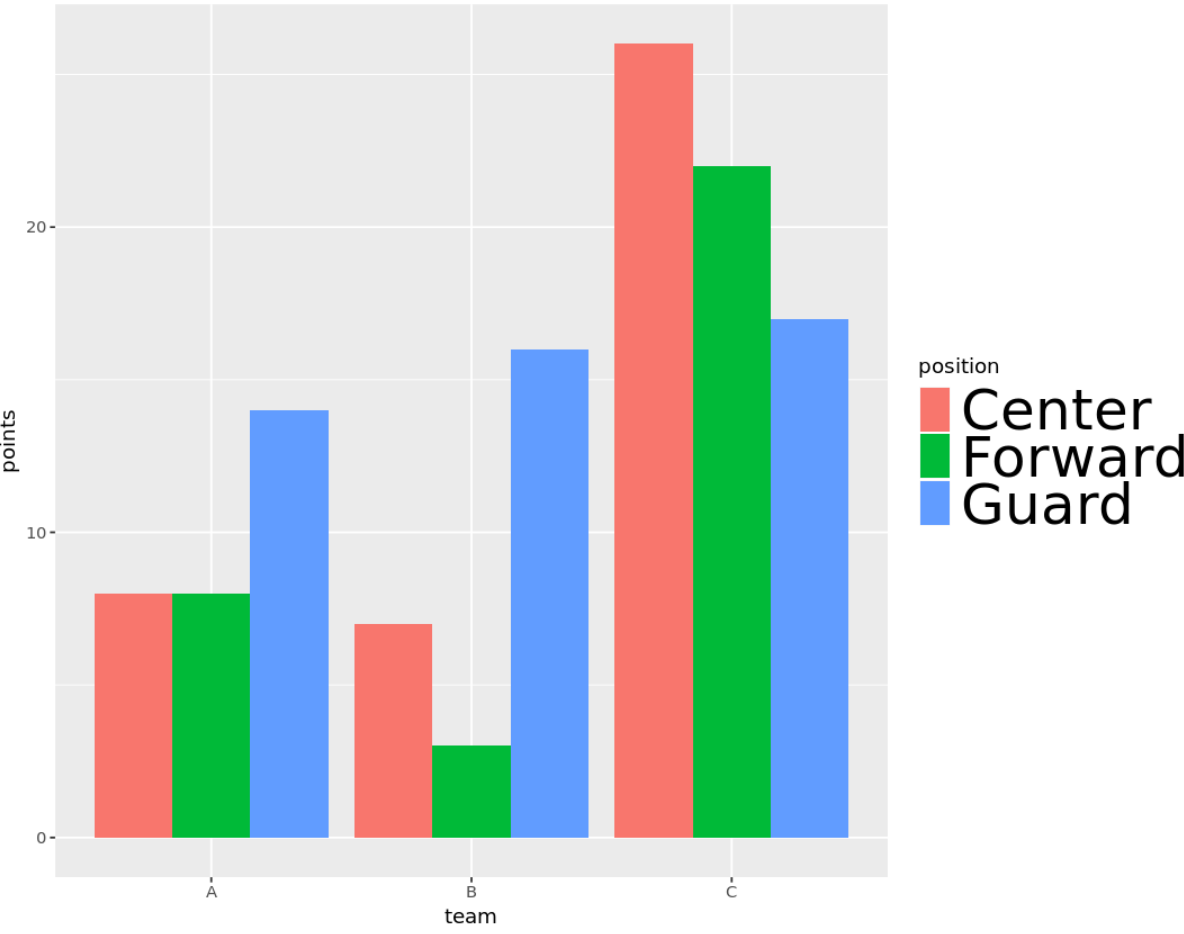
假设我们使用 ggplot2 创建以下 分组条形图:
 library (ggplot2)

#create data frame
df <- data.frame(team=rep(c(' A ', ' B ', ' C '), each =3),
                 position=rep(c(' Guard ', ' Forward ', ' Center '), times =3),
                 dots=c(14, 8, 8, 16, 3, 7, 17, 22, 26))

#create grouped barplot
ggplot(df, aes (fill=position, y=points, x=team)) +
  geom_bar(position=' dodge ', stat=' identity ')
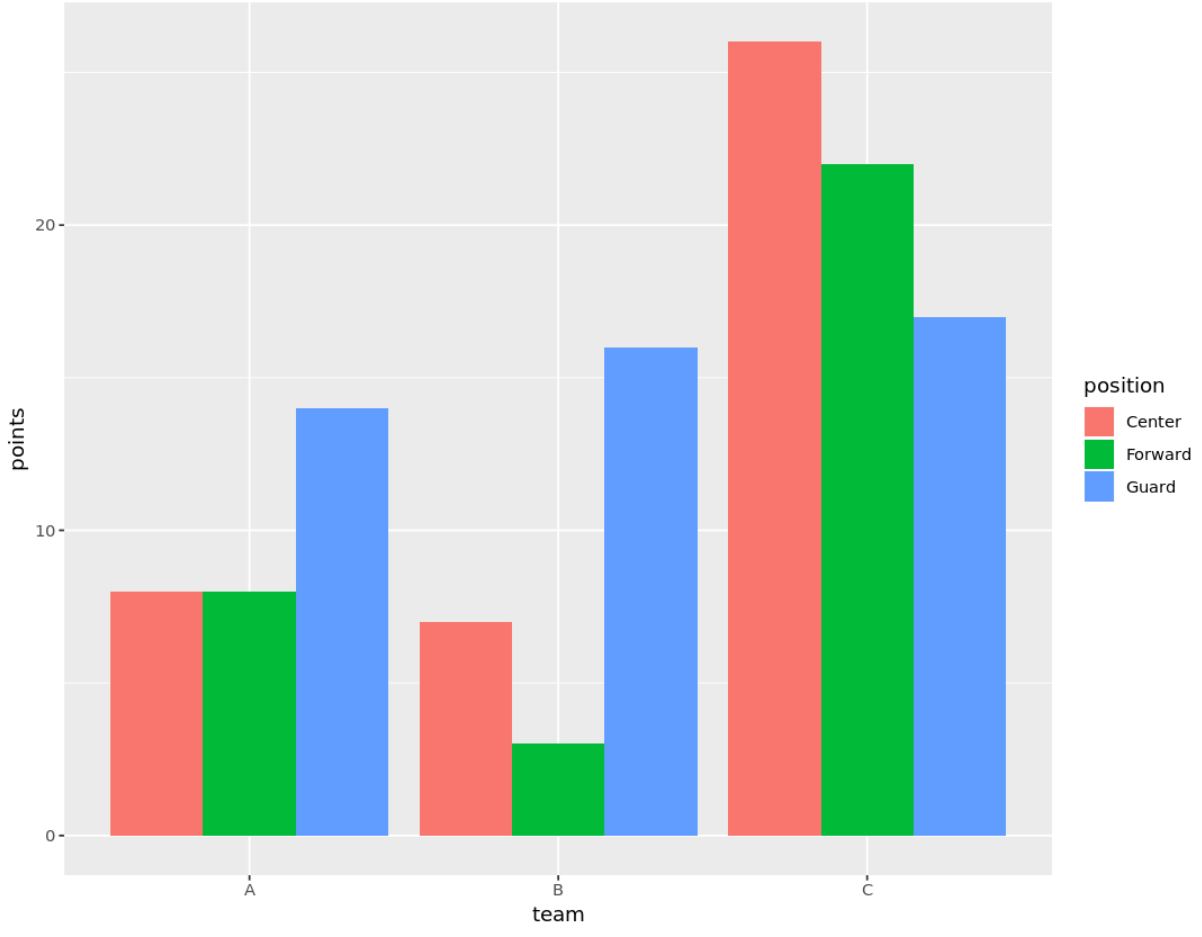
默认情况下,ggplot2 在图表右侧提供图例。
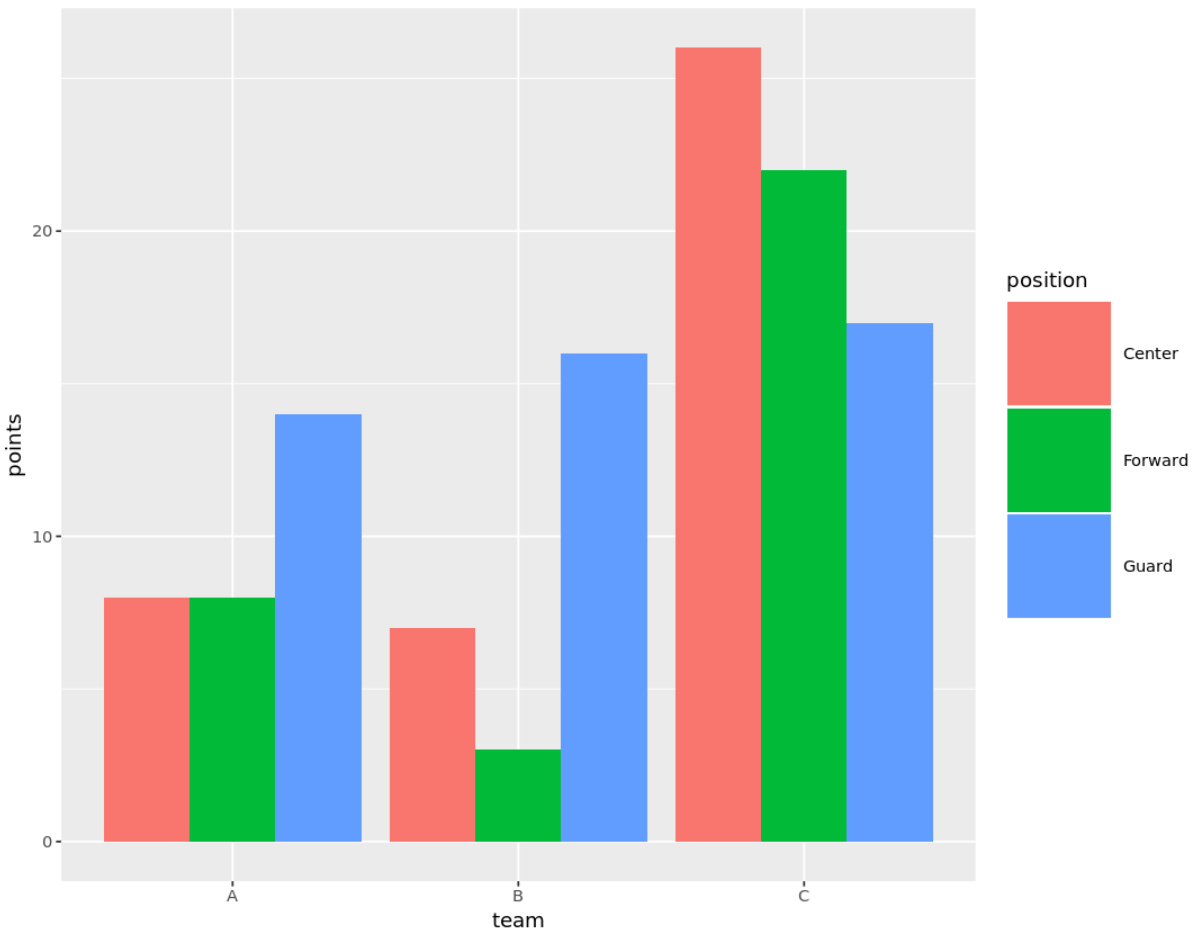
以下代码显示如何使用legend.key.size参数来放大图例键:
 ggplot(df, aes (fill=position, y=points, x=team)) +
  geom_bar(position=' dodge ', stat=' identity ') +
  theme( legend.key.size = unit(2, ' cm '))
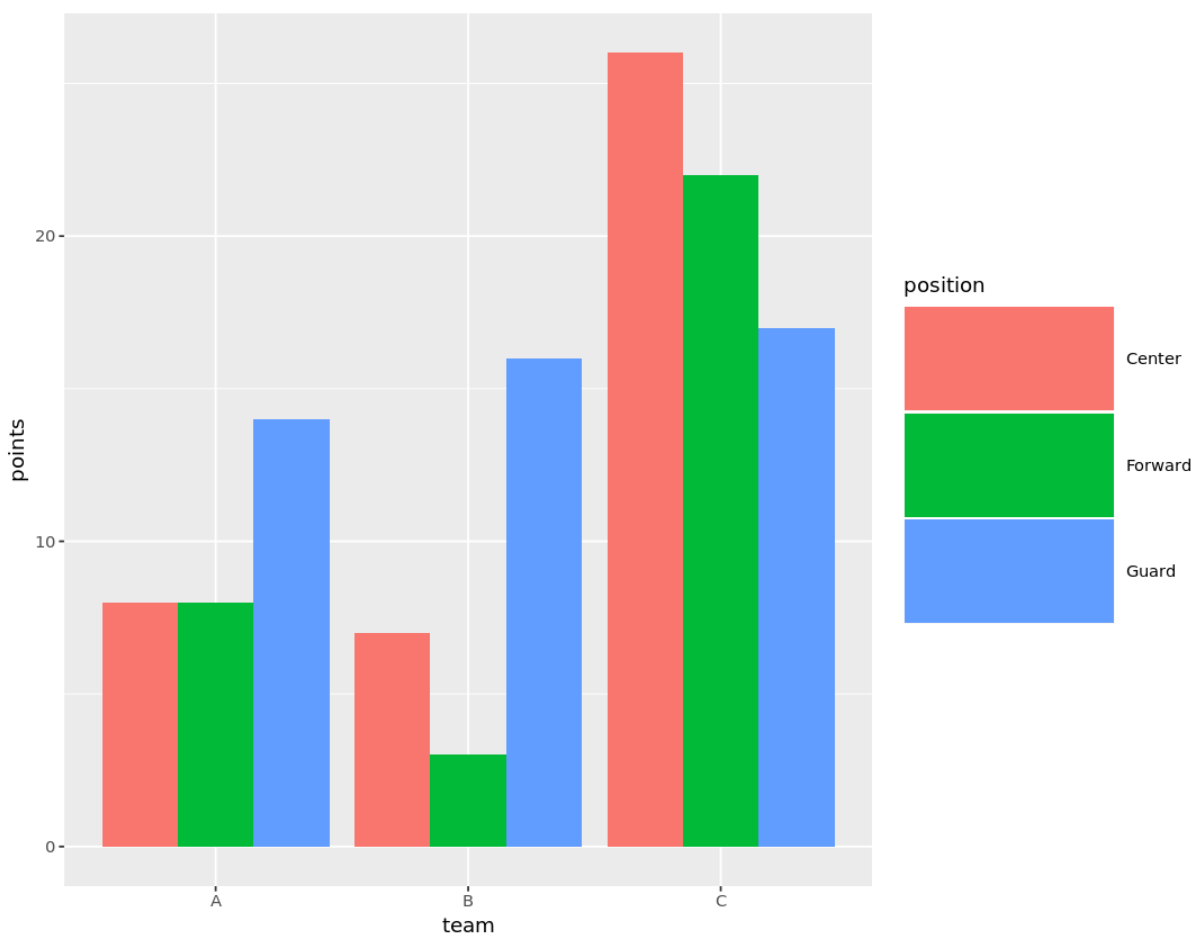
我们还可以使用legend.key.width和legend.key.height参数来指定键的宽度和高度:
 ggplot(df, aes (fill=position, y=points, x=team)) +
  geom_bar(position=' dodge ', stat=' identity ') +
  theme( legend.key.height = unit(2, ' cm '),
        legend.key.width = unit(4, ' cm '))
更改图例标题字体大小ggplot2
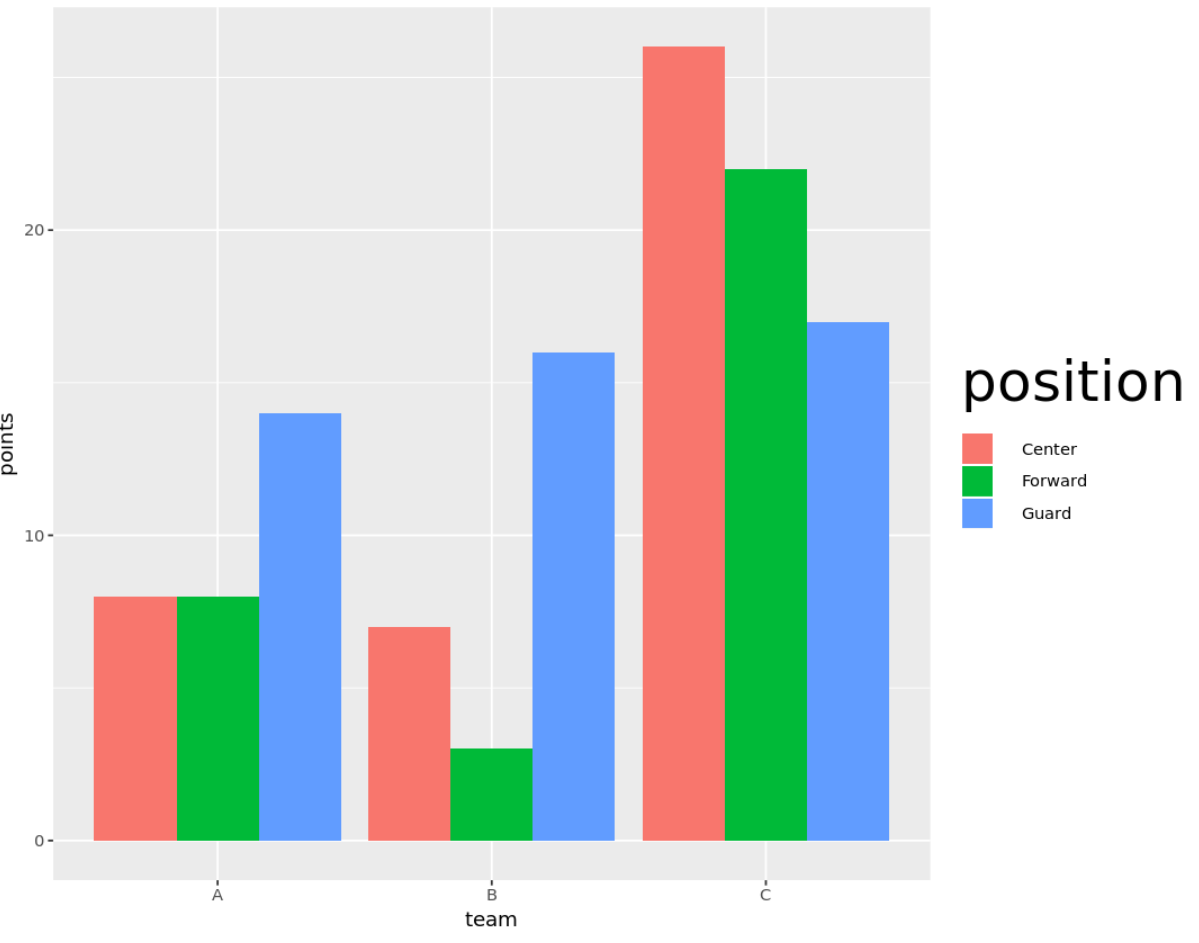
我们可以使用legend.title 参数来放大图例标题的字体大小:
 ggplot(df, aes (fill=position, y=points, x=team)) +
  geom_bar(position=' dodge ', stat=' identity ') +
  theme( legend.title = element_text(size=30))
更改图例文本字体大小ggplot2
我们可以使用legend.text参数来放大图例标题的字体大小:
 ggplot(df, aes (fill=position, y=points, x=team)) +
  geom_bar(position=' dodge ', stat=' identity ') +
  theme( legend.text = element_text(size=30))
其他资源
关于作者
本杰明·安德森博
大家好,我是本杰明,一位退休的统计学教授,后来成为 Statorials 的热心教师。 凭借在统计领域的丰富经验和专业知识,我渴望分享我的知识,通过 Statorials 增强学生的能力。了解更多