Python 中的线性判别分析(逐步)
当您有一组预测变量并希望将响应变量分类为两个或多个类时,可以使用 线性判别分析方法。
本教程提供了如何在 Python 中执行线性判别分析的分步示例。
第 1 步:加载必要的库
首先,我们将加载此示例所需的函数和库:
 from sklearn. model_selection import train_test_split
from sklearn. model_selection import RepeatedStratifiedKFold
from sklearn. model_selection import cross_val_score
from sklearn. discriminant_analysis import LinearDiscriminantAnalysis
from sklearn import datasets
import matplotlib. pyplot as plt
import pandas as pd
import numpy as np
第2步:加载数据
对于此示例,我们将使用 sklearn 库中的iris数据集。以下代码展示了如何加载此数据集并将其转换为 pandas DataFrame 以方便使用:
 #load iris dataset
iris = datasets. load_iris ()

#convert dataset to pandas DataFrame
df = pd.DataFrame(data = np.c_[iris[' data '], iris[' target ']],
                 columns = iris[' feature_names '] + [' target '])
df[' species '] = pd. Categorical . from_codes (iris.target, iris.target_names)
df.columns = [' s_length ', ' s_width ', ' p_length ', ' p_width ', ' target ', ' species ']

#view first six rows of DataFrame
df. head ()

   s_length s_width p_length p_width target species
0 5.1 3.5 1.4 0.2 0.0 setosa
1 4.9 3.0 1.4 0.2 0.0 setosa
2 4.7 3.2 1.3 0.2 0.0 setosa
3 4.6 3.1 1.5 0.2 0.0 setosa
4 5.0 3.6 1.4 0.2 0.0 setosa

#find how many total observations are in dataset
len( df.index )

150
我们可以看到数据集总共包含 150 个观测值。
对于这个例子,我们将构建一个线性判别分析模型来对给定花朵所属的物种进行分类。
我们将在模型中使用以下预测变量:
- 萼片长度
- 萼片宽度
- 花瓣长度
- 花瓣宽度
我们将使用它们来预测物种响应变量,该变量支持以下三个潜在类别:
- 山毛榉
- 杂色
- 弗吉尼亚州
步骤3:调整LDA模型
接下来,我们将使用 sklearn 的LinearDiscriminantAnalsys函数将 LDA 模型拟合到我们的数据:
 #define predictor and response variables
X = df[[' s_length ',' s_width ',' p_length ',' p_width ']]
y = df[' species ']

#Fit the LDA model
model = LinearDiscriminantAnalysis()
model. fit (x,y)
第 4 步:使用模型进行预测
一旦我们使用数据拟合了模型,我们就可以使用重复分层 k 倍交叉验证来评估模型的性能。
在此示例中,我们将使用 10 次折叠和 3 次重复:
 #Define method to evaluate model
cv = RepeatedStratifiedKFold(n_splits= 10 , n_repeats= 3 , random_state= 1 )

#evaluate model
scores = cross_val_score(model, X, y, scoring=' accuracy ', cv=cv, n_jobs=-1)
print( np.mean (scores))

0.9777777777777779
我们可以看到该模型的平均准确率达到了97.78% 。
我们还可以使用该模型根据输入值来预测新花属于哪个类:
 #define new observation
new = [5, 3, 1, .4]

#predict which class the new observation belongs to
model. predict ([new])

array(['setosa'], dtype='<U10')
我们看到模型预测这个新观察结果属于称为setosa的物种。
第 5 步:可视化结果
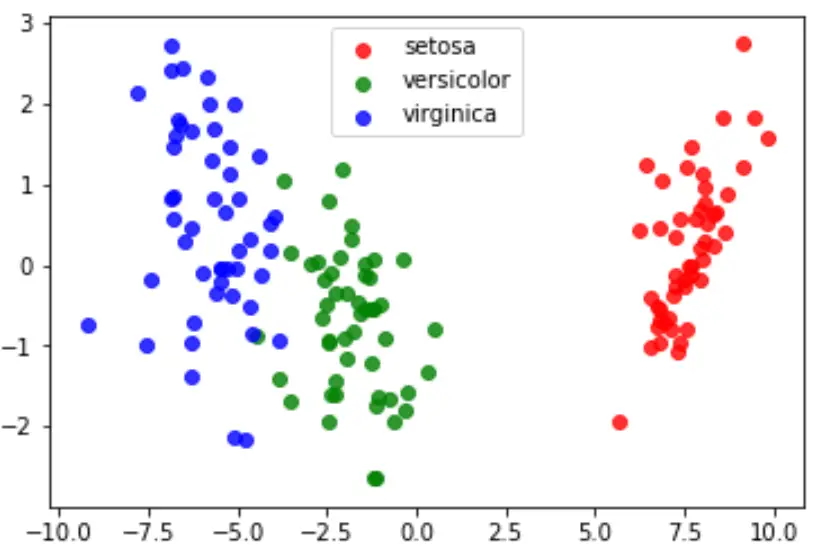
最后,我们可以创建一个 LDA 图来可视化模型的线性判别式,并可视化它在数据集中区分三个不同物种的效果:
 #define data to plot
X = iris.data
y = iris.target
model = LinearDiscriminantAnalysis()
data_plot = model. fit (x,y). transform (X)
target_names = iris. target_names

#create LDA plot
plt. figure ()
colors = [' red ', ' green ', ' blue ']
lw = 2
for color, i, target_name in zip(colors, [0, 1, 2], target_names):
    plt. scatter (data_plot[y == i, 0], data_plot[y == i, 1], alpha=.8, color=color,
                label=target_name)

#add legend to plot
plt. legend (loc=' best ', shadow= False , scatterpoints=1)

#display LDA plot
plt. show ()

您可以在此处找到本教程中使用的完整 Python 代码。