如何填充 matplotlib 中线之间的区域
您可以使用以下函数轻松填充 Matplotlib 图中值之间的区域:
- fill_ Between() :填充两条水平曲线之间的区域。
- fill_ Betweenx() :填充两条垂直曲线之间的区域。
本教程提供了如何在实践中使用每个函数的示例。
示例 1:填充两条水平线之间的区域
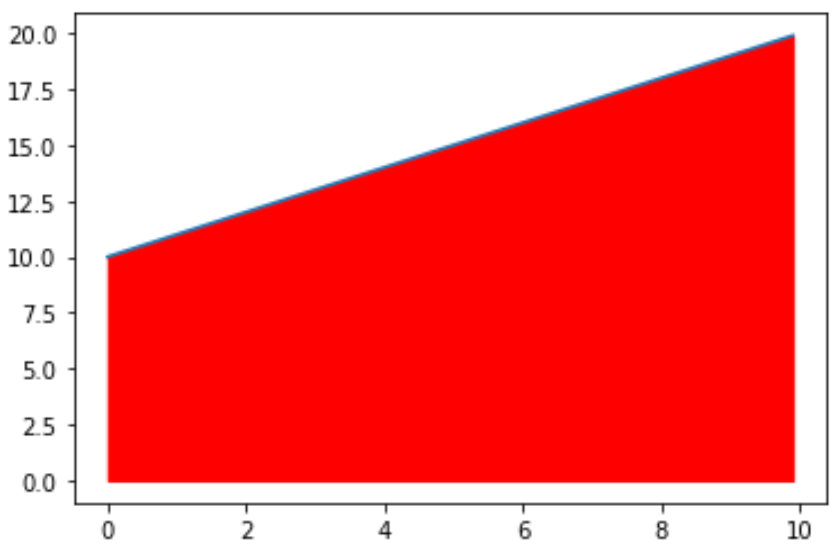
以下代码显示如何填充两条水平线之间的区域:
 import matplotlib. pyplot as plt
import numpy as np

#define x and y values
x = np. arange (0,10,0.1)
y = np. arange (10,20,0.1)

#create plot of values
plt. plot (x,y)

#fill in area between the two lines
plt. fill_between (x,y,color=' red ')
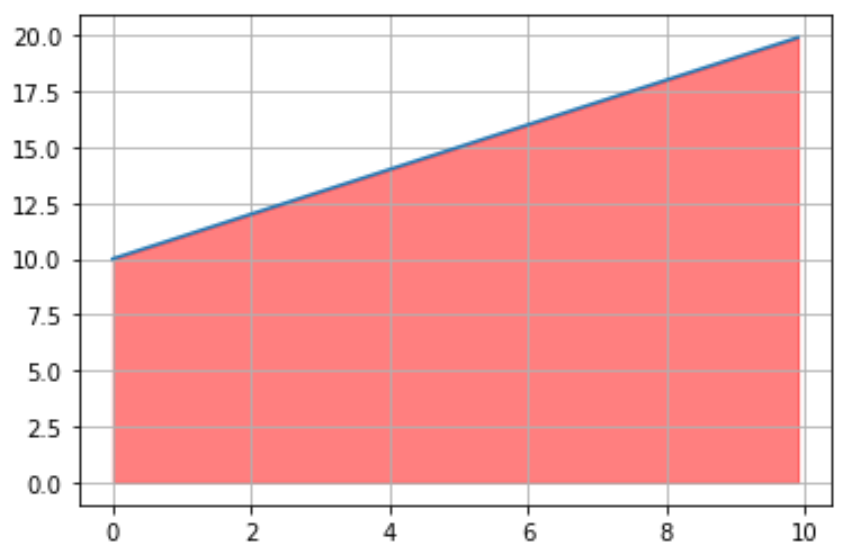
请注意,我们还可以使用plt.grid()函数向绘图添加网格,以更轻松地查看填充了哪些值:
 import matplotlib. pyplot as plt
import numpy as np

#define x and y values
x = np. arange (0,10,0.1)
y = np. arange (10,20,0.1)

#create plot of values
plt. plot (x,y)

#fill in area between the two lines
plt. fill_between (x, y, color=' red ', alpha= .5 )

#add gridlines
plt. grid ()
示例 2:填充曲线下的区域
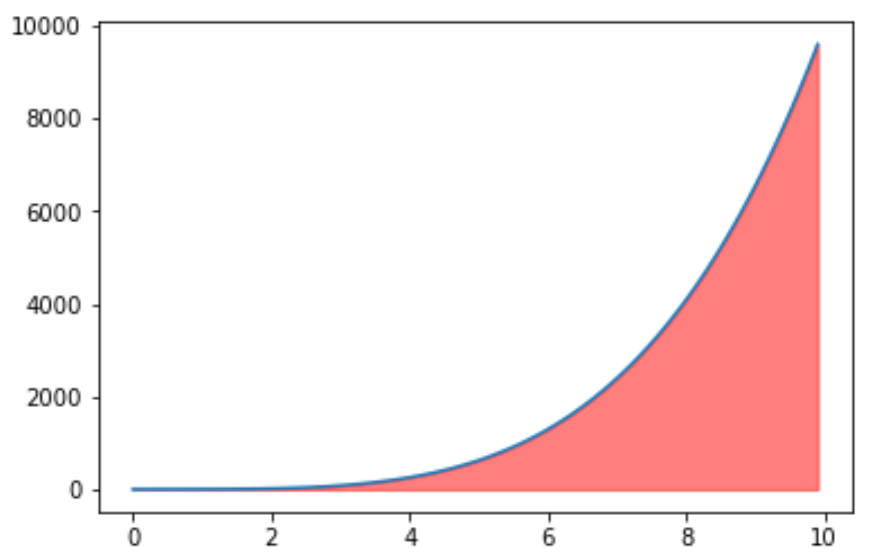
以下代码显示了如何填充曲线下的区域:
 import matplotlib. pyplot as plt
import numpy as np

#define x and y values
x = np. arange (0,10,0.1)
y = x**4

#create plot of values
plt. plot (x,y)

#fill in area between the two lines
plt. fill_between (x, y, color=' red ', alpha= .5 )
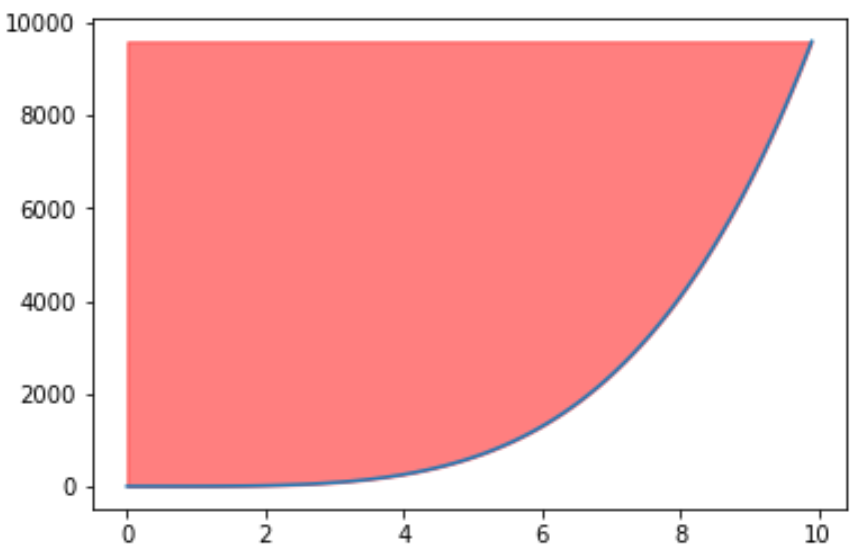
示例 3:填充曲线上方的区域
以下代码显示了如何填充曲线上方的区域:
 import matplotlib. pyplot as plt
import numpy as np

#define x and y values
x = np. arange (0,10,0.1)
y = x**4

#create plot of values
plt. plot (x,y)

#fill in area between the two lines
plt. fill_between (x, y, np. max (y), color=' red ', alpha= .5 )
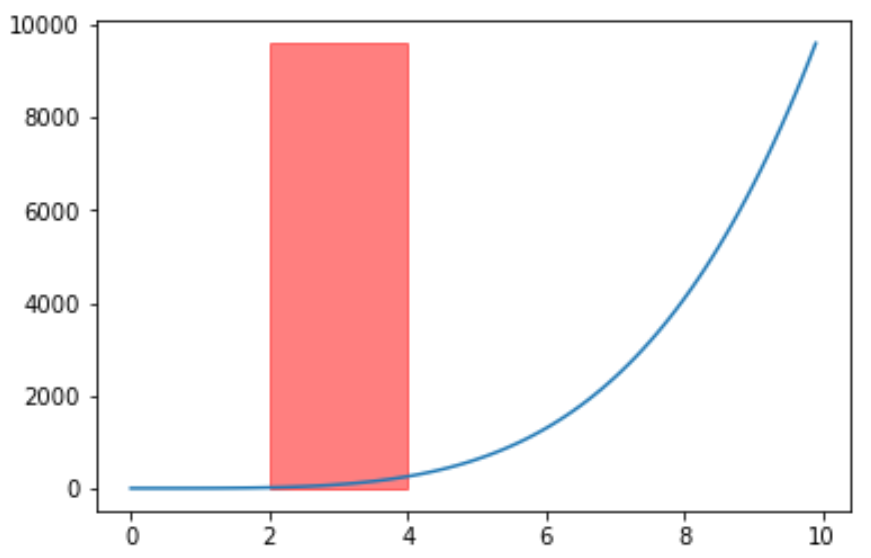
示例 4:填充两条垂直线之间的区域
以下代码显示如何使用fill_ Betweenx()函数填充两条垂直线之间的区域:
 import matplotlib. pyplot as plt
import numpy as np

#define x and y values
x = np. arange (0,10,0.1)
y = np. arange (10,20,0.1)

#create plot of values
plt. plot (x,y)

#fill in area between the two lines
plt. fill_betweenx (y, 2, 4, color=' red ', alpha= .5 )
