如何在 matplotlib 中绘制矩形(附示例)
要在 Matplotlib 中绘制矩形,可以使用matplotlib.patches.Rectangle函数,该函数使用以下语法:
matplotlib.patches.Rectangle(xy,宽度,高度,角度=0.0)
金子:
- xy:矩形锚点的坐标(x,y)
- width:矩形的宽度
- height:矩形的高度
- angle:绕 xy 逆时针旋转(默认为 0)
本教程提供了该功能实际使用的几个示例。
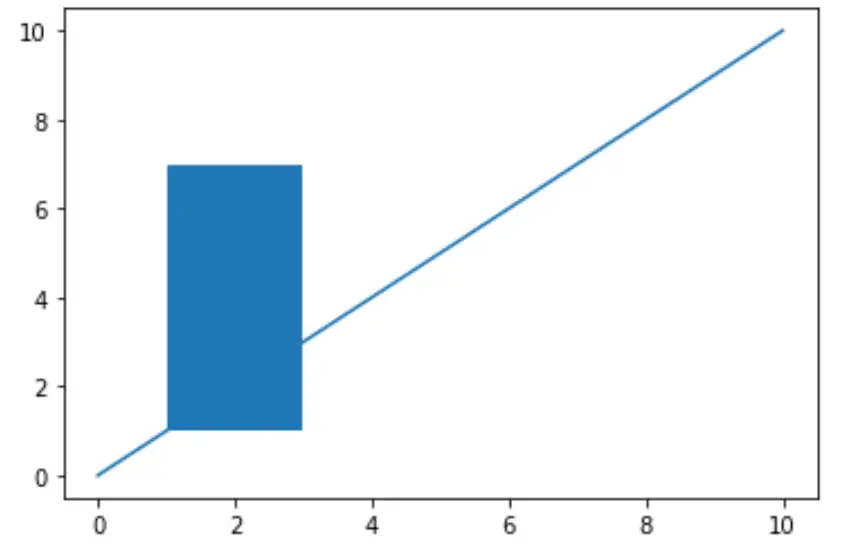
示例1:在路径上绘制一个矩形
以下代码展示了如何在 Matplotlib 图上绘制宽度为 2、高度为 6 的矩形:
 import matplotlib. pyplot as plt
from matplotlib. patches import Rectangle

#define Matplotlib figure and axis
fig, ax = plt. subplots ()

#create simple line plot
ax. plot ([0, 10],[0, 10])

#add rectangle to plot
ax. add_patch (Rectangle((1, 1), 2, 6))

#displayplot
plt. show ()

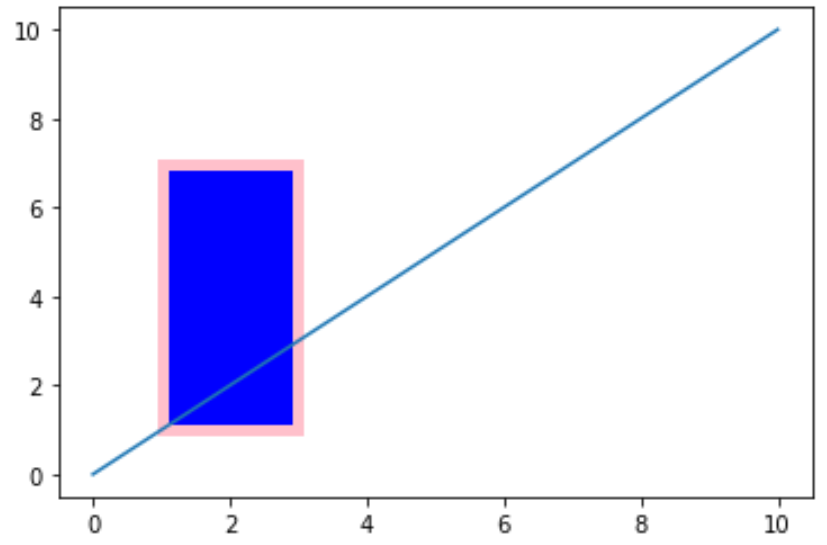
示例 2:风格化矩形
以下代码显示了如何设置矩形的样式:
 import matplotlib. pyplot as plt
from matplotlib. patches import Rectangle

#define Matplotlib figure and axis
fig, ax = plt. subplots ()

#create simple line plot
ax. plot ([0, 10],[0, 10])

#add rectangle to plot
ax. add_patch (Rectangle((1, 1), 2, 6,
             edgecolor = ' pink ',
             facecolor = ' blue ',
             fill= True ,
             lw= 5 ))

#displayplot
plt. show ()

您可以在此处找到可应用于矩形的样式属性的完整列表。
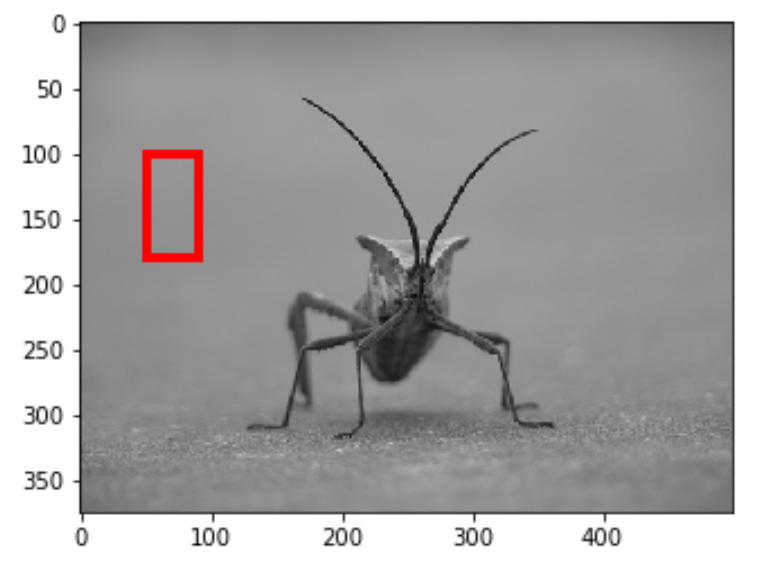
示例 3:在图像上绘制矩形
以下代码演示了如何在 Matplotilb 中在图像上绘制矩形。请注意,此示例中使用的图像来自此 Matplotlib 教程。
要重现此示例,只需从本教程下载图钉照片并将其保存到您自己的计算机上即可。
 import matplotlib. pyplot as plt
from matplotlib. patches import Rectangle
from PIL import Image

#display the image
plt. imshow ( Image.open (' stinkbug.png '))

#add rectangle
plt. gca (). add_patch (Rectangle((50,100),40,80,
                    edgecolor=' red ',
                    facecolor=' none ',
                    lw= 4 ))

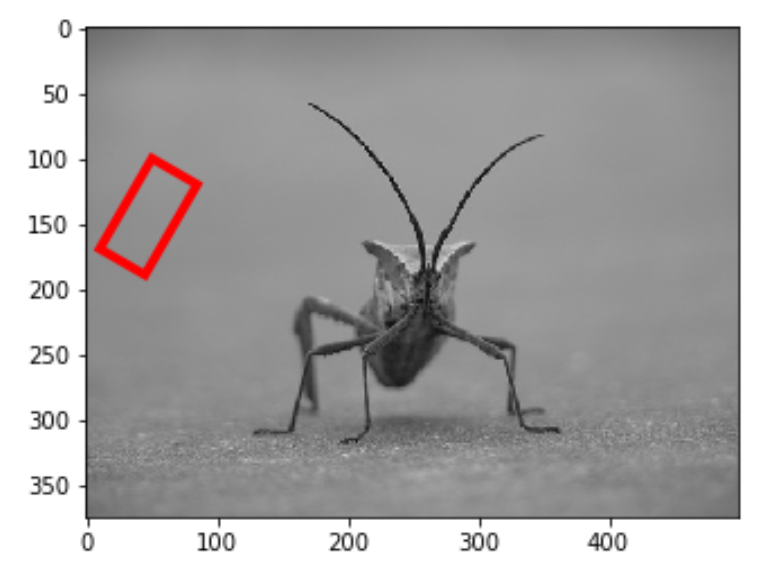
请注意,我们可以使用角度参数将矩形逆时针旋转一定度数:
 import matplotlib. pyplot as plt
from matplotlib. patches import Rectangle
from PIL import Image

#display the image
plt. imshow ( Image.open (' stinkbug.png '))

#add rectangle
plt. gca (). add_patch (Rectangle((50,100),40,80,
                    angle= 30 ,
                    edgecolor=' red ',
                    facecolor=' none ',
                    lw= 4 ))
