如何向 matplotlib 绘图添加文本(附示例)
您可以使用matplotlib.pyplot.text()函数轻松地将文本添加到 Matplotlib 图中,该函数使用以下语法:
matplotlib.pyplot.text(x, y, s, fontdict=None)
金子:
- x:文本的x坐标
- y:文本的 y 坐标
- s:文本字符串
- fontdict:覆盖默认文本属性的字典
本教程展示了此功能实际使用的几个示例。
示例 1:向 Matplotlib 绘图添加唯一文本
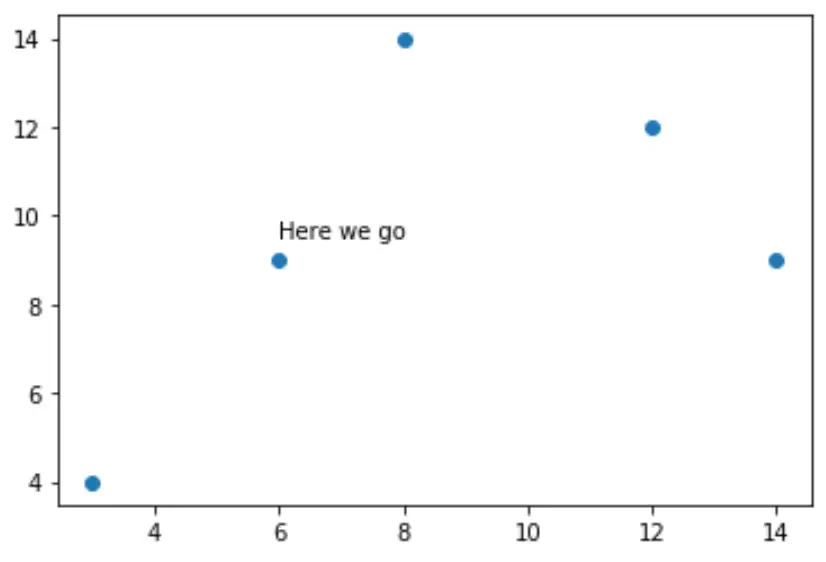
以下代码演示了如何创建散点图并向图中添加一段文本:
 import matplotlib. pyplot as plt

#createdata
x = [3, 6, 8, 12, 14]
y = [4, 9, 14, 12, 9]

#create scatterplot
plt. scatter (x,y)

#add text at (x, y) coordinates = (6, 9.5)
plt. text (6, 9.5, ' Here we go ')

示例 2:将多个文本添加到 Matplotlib 图中
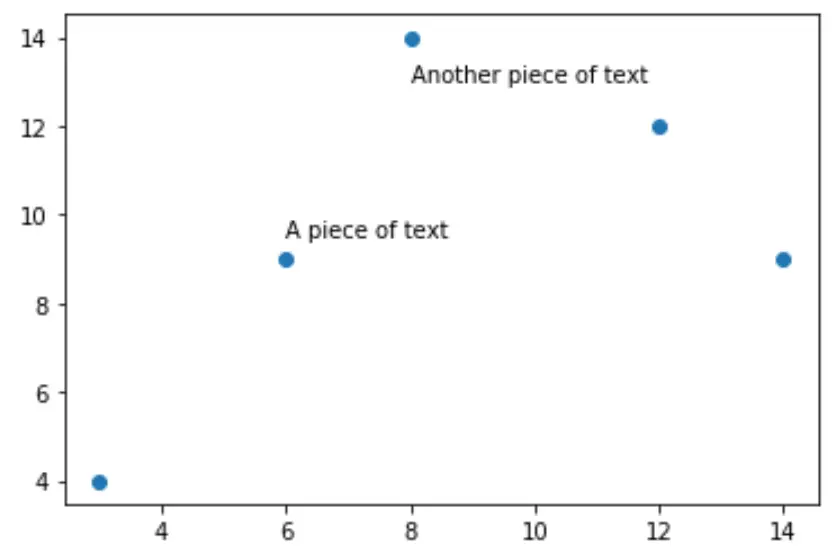
以下代码演示了如何创建散点图并向图中添加多段文本:
 import matplotlib. pyplot as plt

#create data
x = [3, 6, 8, 12, 14]
y = [4, 9, 14, 12, 9]

#create scatterplot
plt. scatter (x,y)

#add text at (x, y) coordinates = (6, 9.5)
plt. text (6, 9.5, ' A piece of text ')

#add another piece of text
plt. text (8, 13, ' Another piece of text ')

示例 3:编辑文本属性
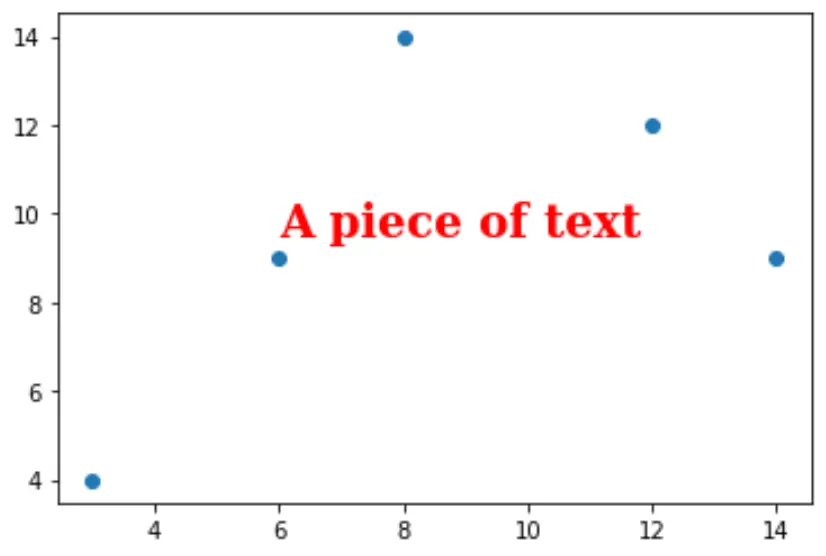
要更改文本属性,我们可以创建一个指定字体属性的字典。
以下代码展示了如何执行此操作:
 import matplotlib. pyplot as plt

#createdata
x = [3, 6, 8, 12, 14]
y = [4, 9, 14, 12, 9]

#create scatterplot
plt. scatter (x,y)

font = {' family ': ' serif ',
        ' color ': ' red ',
        ' weight ': ' bold ',
        ' size ': 20
        }

#add text with custom font
plt. text (6, 9.5, ' A piece of text ', fontdict=font)

示例 4:在文本周围添加框架
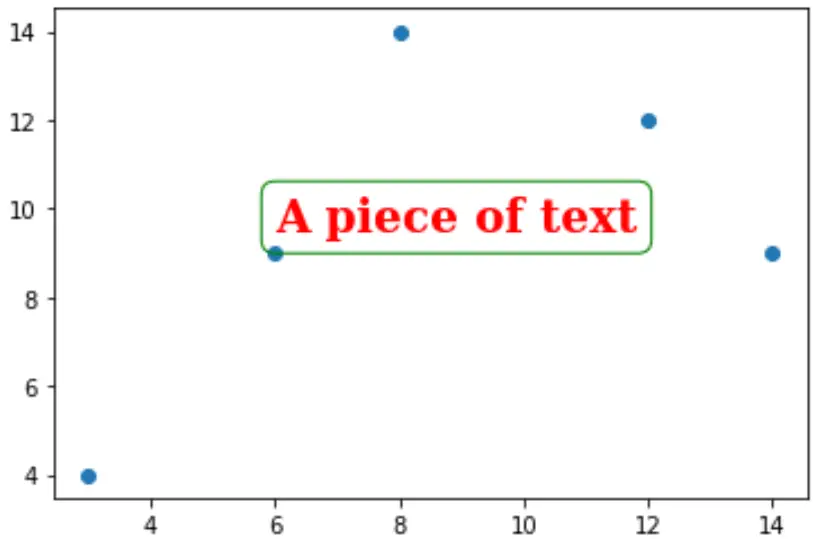
以下代码显示如何在文本周围添加框架:
 import matplotlib. pyplot as plt

#createdata
x = [3, 6, 8, 12, 14]
y = [4, 9, 14, 12, 9]

#create scatterplot
plt. scatter (x,y)

font = {' family ': ' serif ',
        ' color ': ' red ',
        ' weight ': ' bold ',
        ' size ': 20
        }

box = {' facecolor ': ' none ',
       ' edgecolor ': ' green ',
       ' boxstyle ': ' round '
      }

#add text with custom font
plt. text (6, 9.5, ' A piece of text ', fontdict=font, bbox=box)
