如何在 r 中绘制逻辑回归曲线
通常,您可能想在 R 中绘制拟合逻辑回归模型的曲线。
幸运的是,这很容易做到,本教程解释了如何在基础 R 和 ggplot2 中做到这一点。
示例:在 R 基数中绘制逻辑回归曲线
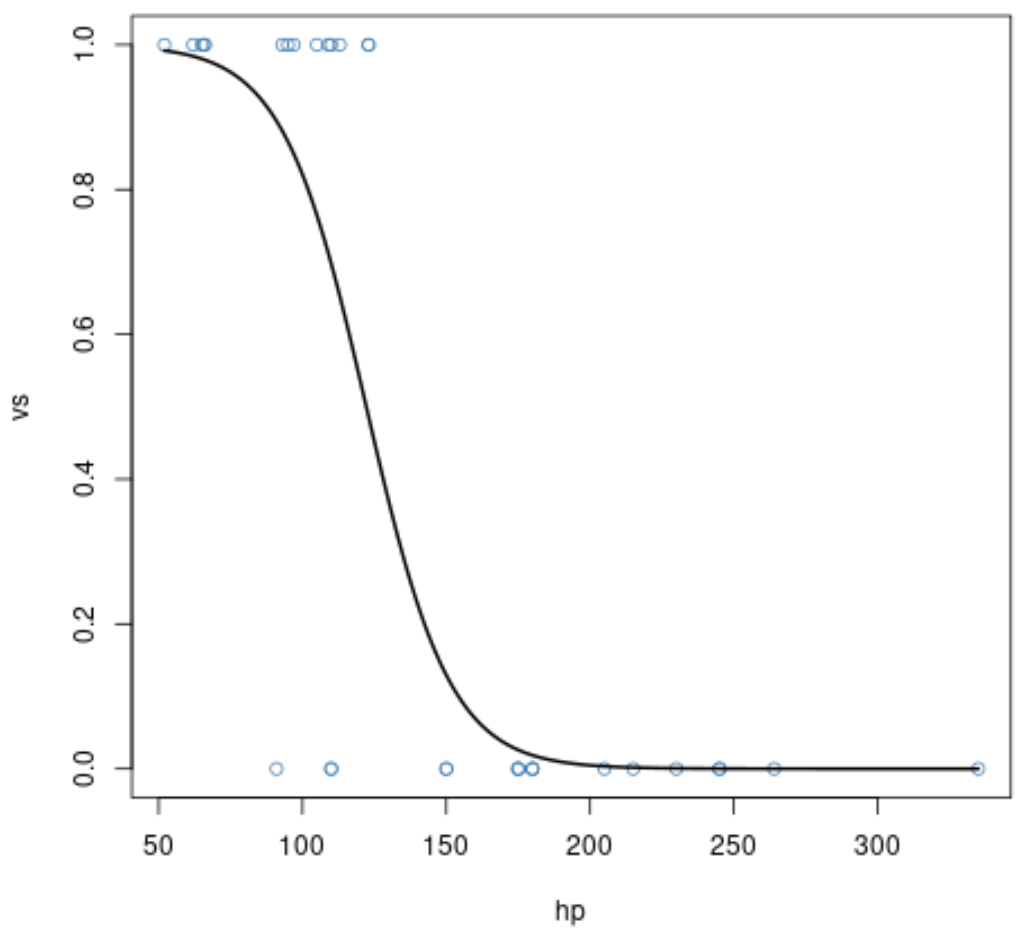
以下代码展示了如何使用 R 中内置 mtcars 数据集的变量来拟合逻辑回归模型,以及如何绘制逻辑回归曲线:
 #fit logistic regression model
model <- glm(vs ~ hp, data=mtcars, family=binomial)

#define new data frame that contains predictor variable
newdata <- data. frame (hp=seq(min(mtcars$hp), max(mtcars$hp),len= 500 ))

#use fitted model to predict values of vs
newdata$vs = predict(model, newdata, type=" response ")

#plot logistic regression curve
plot(vs ~hp, data=mtcars, col=" steelblue ")
lines(vs ~ hp, newdata, lwd= 2 )

x 轴显示预测变量hp的值,y 轴显示响应变量am的预测概率。
我们可以清楚地看到,预测变量hp的值越高,响应变量vs等于 1 的概率越低。
示例:在 ggplot2 中绘制逻辑回归曲线
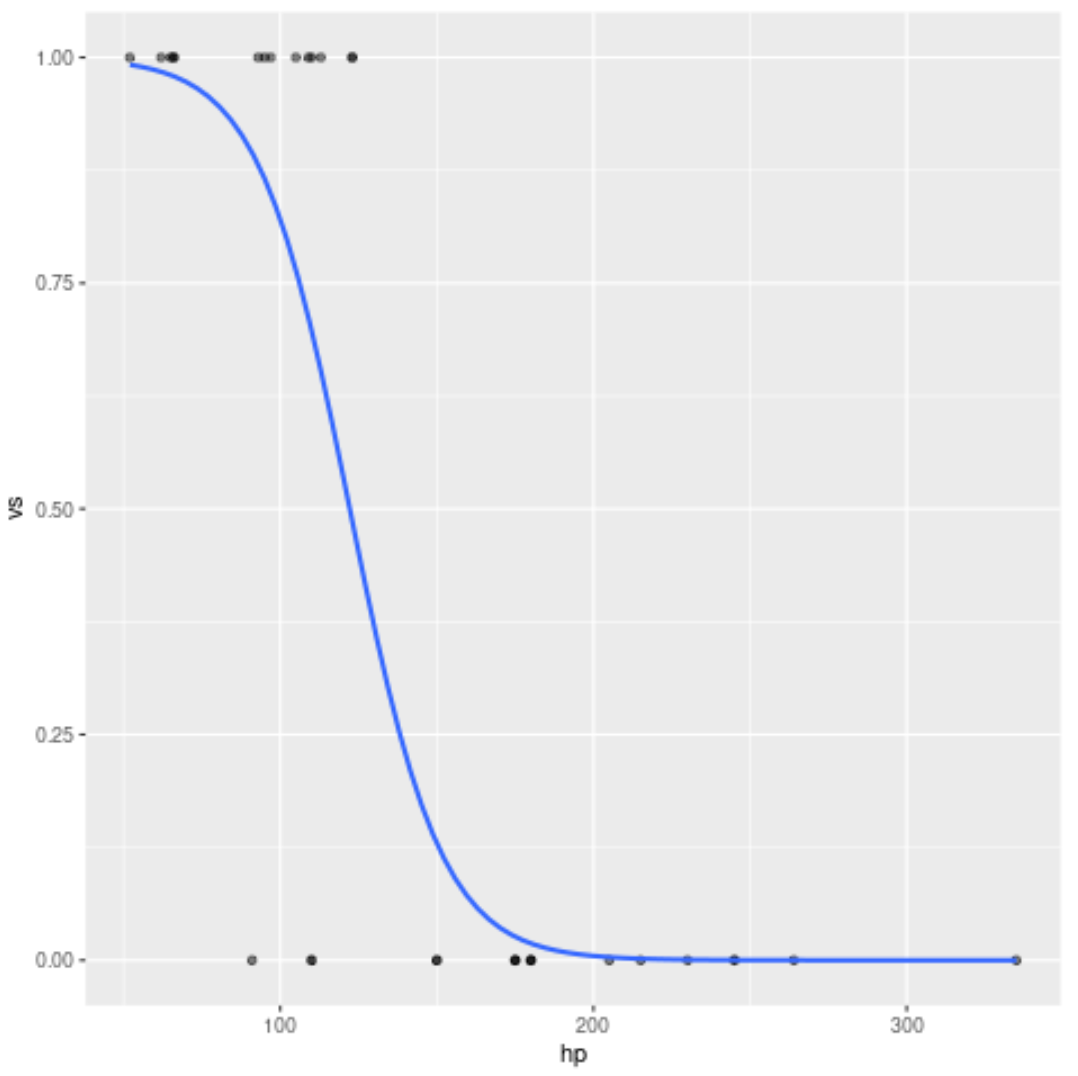
以下代码展示了如何拟合相同的逻辑回归模型以及如何使用ggplot2数据可视化库绘制逻辑回归曲线:
 library (ggplot2)

#plot logistic regression curve
ggplot(mtcars, aes (x=hp, y=vs)) +
  geom_point(alpha=.5) +
  stat_smooth(method=" glm ", se=FALSE, method. args = list(family=binomial))

请注意,这与上一个使用 R 基的示例中生成的曲线完全相同。
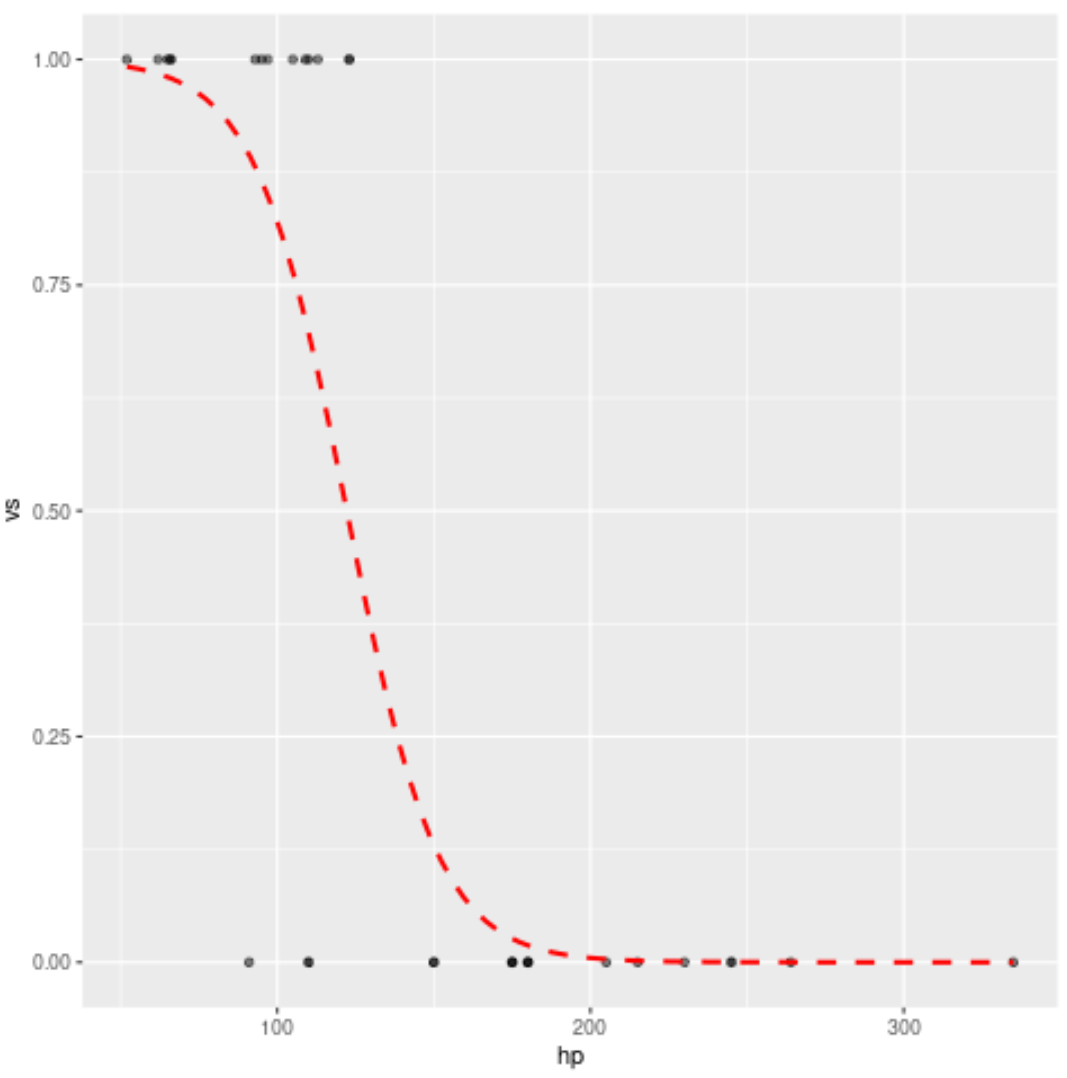
也可以随意更改曲线的样式。例如,我们可以将曲线变成红色虚线:
 library (ggplot2)

#plot logistic regression curve
ggplot(mtcars, aes (x=hp, y=vs)) +
  geom_point(alpha=.5) +
  stat_smooth(method=" glm ", se=FALSE, method. args = list(family=binomial),
              col=" red ", lty= 2 )

其他资源
逻辑回归简介
如何在 R 中执行逻辑回归(逐步)
如何在 Python 中执行逻辑回归(逐步)
如何使用R中的seq函数