如何更改 matplotlib 中的刻度数
您可以使用以下语法更改 Matplotlib 中每个轴上的刻度数:
 #specify number of ticks on x-axis
plt. locator_params (axis=' x ', nbins= 4 )

#specify number of ticks on y-axis
plt. locator_params (axis=' y ', nbins= 2 )
nbins参数指定每个轴上显示的刻度数。
以下示例展示了如何在实践中使用此语法。
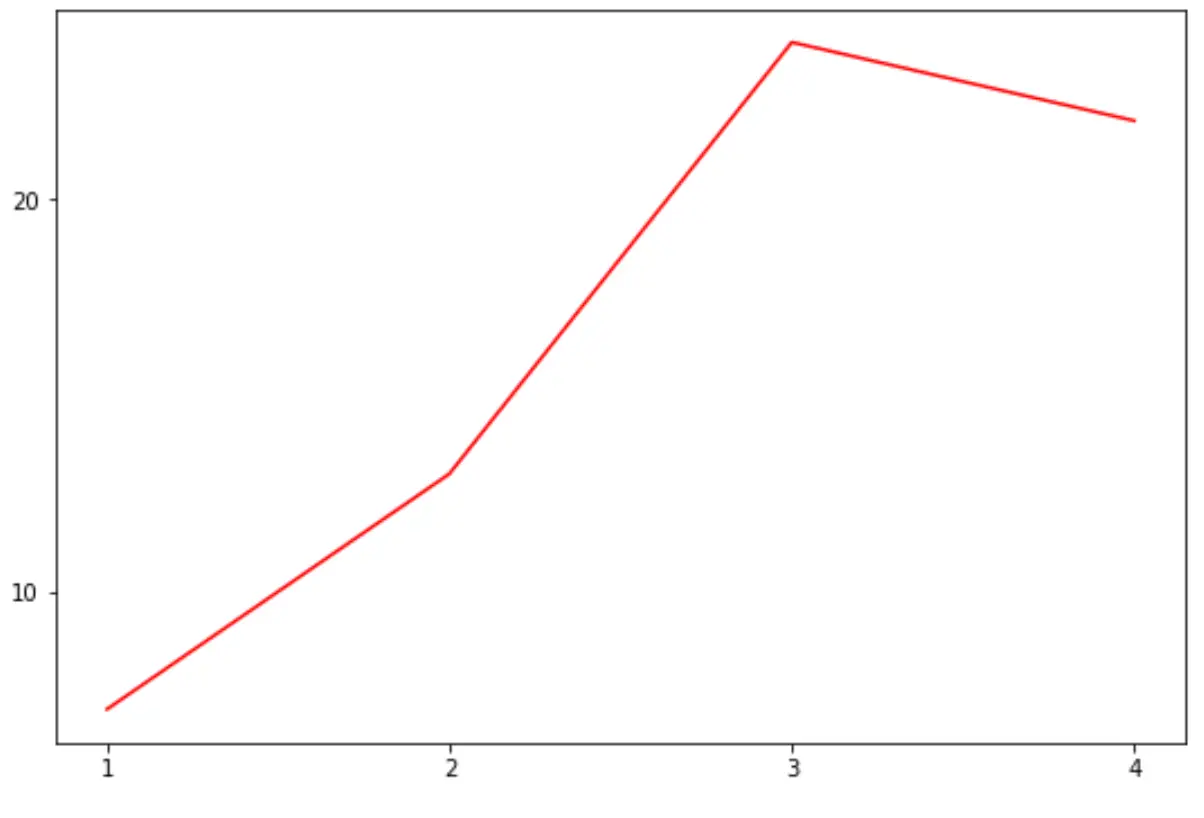
示例 1:指定两个轴上的刻度数
以下代码显示如何指定绘图中轴上的刻度数:
 import matplotlib. pyplot as plt

#define data
x = [1, 2, 3, 4]
y = [7, 13, 24, 22]

#createplot
plt. plot (x,y,color=' red ')

#specify number of ticks on axes
plt. locator_params (axis=' x ', nbins= 4 )
plt. locator_params (axis=' y ', nbins= 2 )

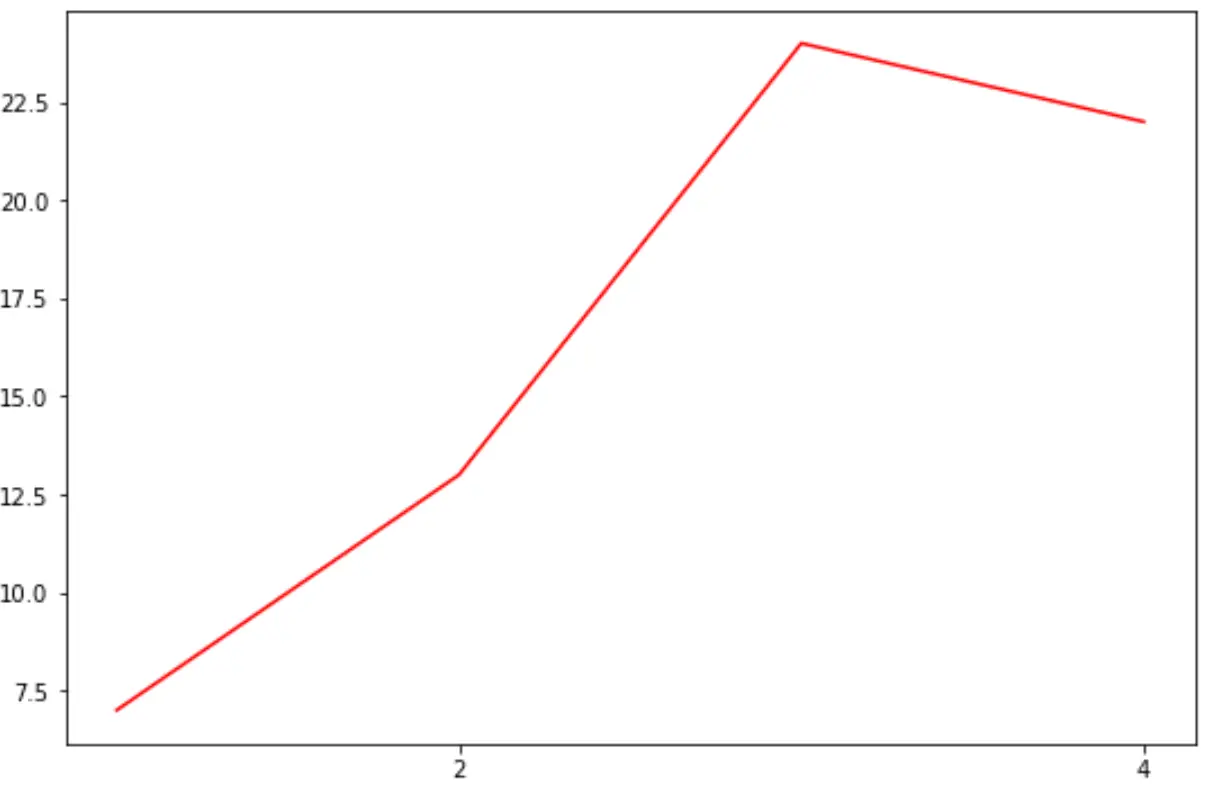
示例 2:仅指定 X 轴上的刻度线数量
以下代码显示如何仅指定 X 轴上的刻度数:
 import matplotlib. pyplot as plt

#define data
x = [1, 2, 3, 4]
y = [7, 13, 24, 22]

#createplot
plt. plot (x,y,color=' red ')

#specify number of ticks on x-axis
plt. locator_params (axis=' x ', nbins= 2 )

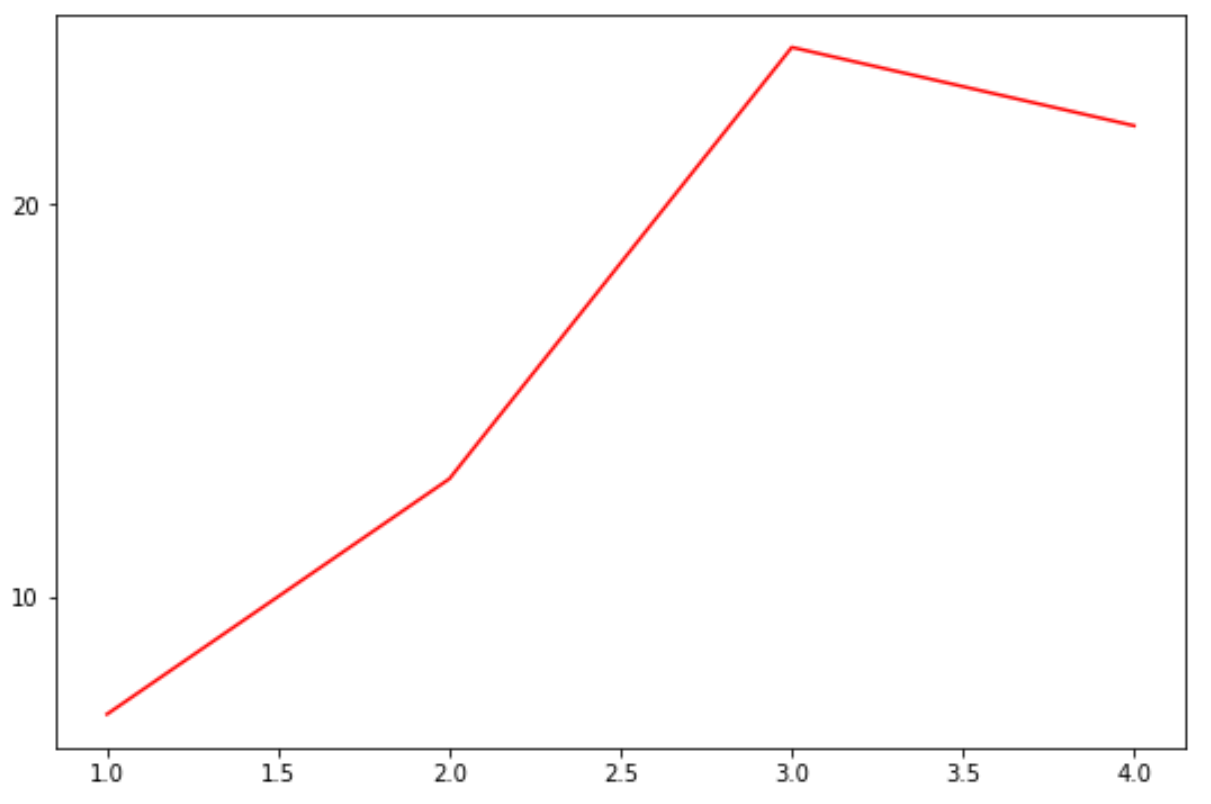
示例 3:仅指定 Y 轴上的刻度线数量
以下代码显示如何仅指定 Y 轴上的刻度数:
 import matplotlib. pyplot as plt

#define data
x = [1, 2, 3, 4]
y = [7, 13, 24, 22]

#createplot
plt. plot (x,y,color=' red ')

#specify number of ticks on y-axis
plt. locator_params (axis=' y ', nbins= 2 )

其他资源
如何从 Matplotlib 图中删除刻度
如何在 Matplotlib 中设置复选标记标签的字体大小
如何在Matplotlib中设置X轴值
如何在 Matplotlib 中设置轴范围