如何在 matplotlib 中使用 tight_layout()
您可以使用 Matplotlib 中的Tight_layout()函数自动调整子图之间和子图周围的填充。
下面的例子展示了如何在实际中使用这个功能。
示例:如何在 Matplotlib 中使用 Tight_layout()
假设我们使用 Matplotilb 在 2×2 网格中创建四个子图:
 import matplotlib. pyplot as plt

#define data
x = [1, 2, 3]
y = [7, 13, 24]

#define layout for subplots
fig, ax = plt. subplots (2, 2)

#define subplot titles
ax[0, 0]. plot (x,y,color=' red ')
ax[0, 1]. plot (x,y,color=' blue ')
ax[1, 0]. plot (x,y,color=' green ')
ax[1, 1]. plot (x,y,color=' purple ')

#add title to each subplot
ax[0, 0]. set_title (' First Subplot ')
ax[0, 1]. set_title (' Second Subplot ')
ax[1, 0]. set_title (' Third Subplot ')
ax[1, 1]. set_title (' Fourth Subplot ')

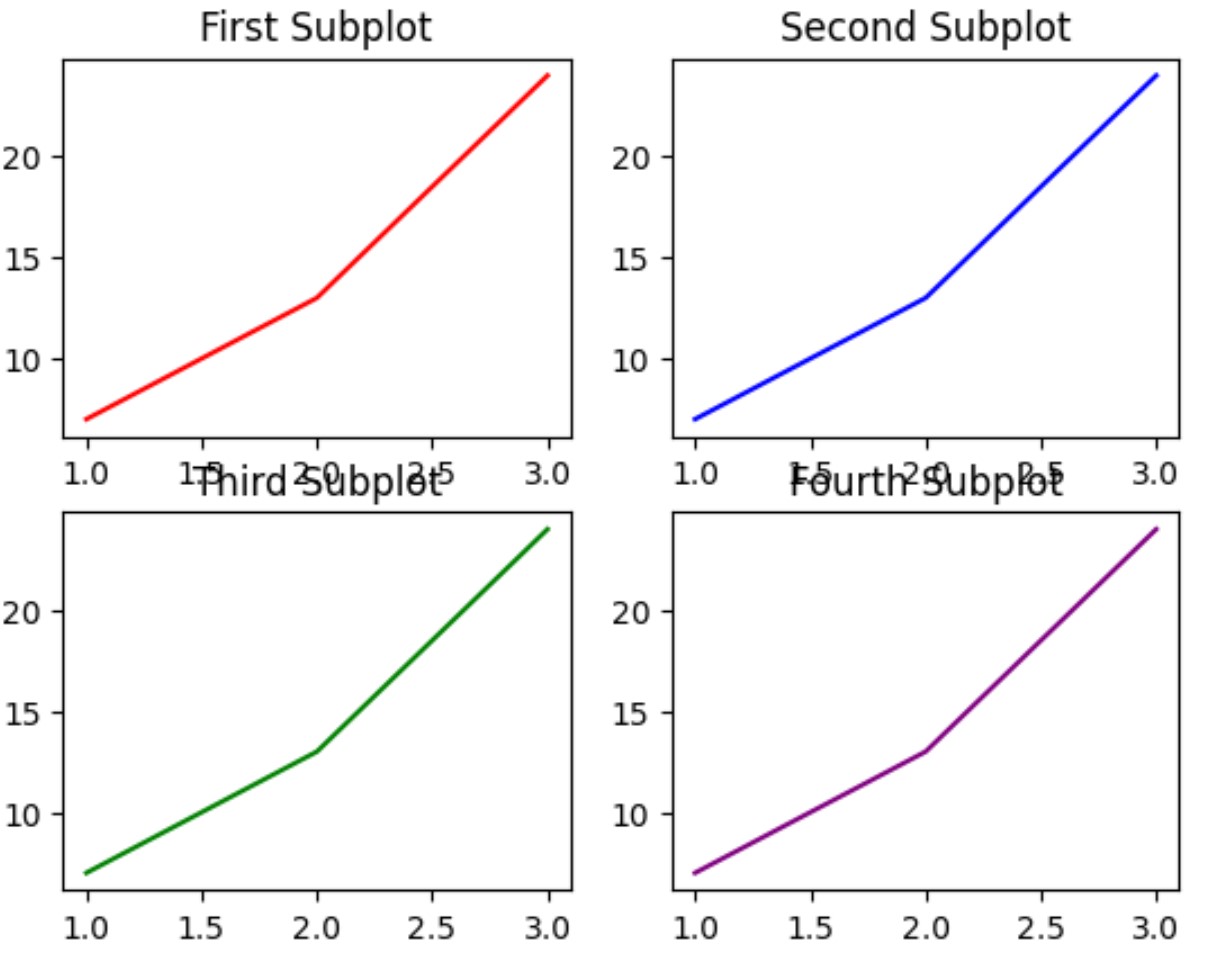
请注意,子图之间的填充最少,导致某些地方的标题重叠。
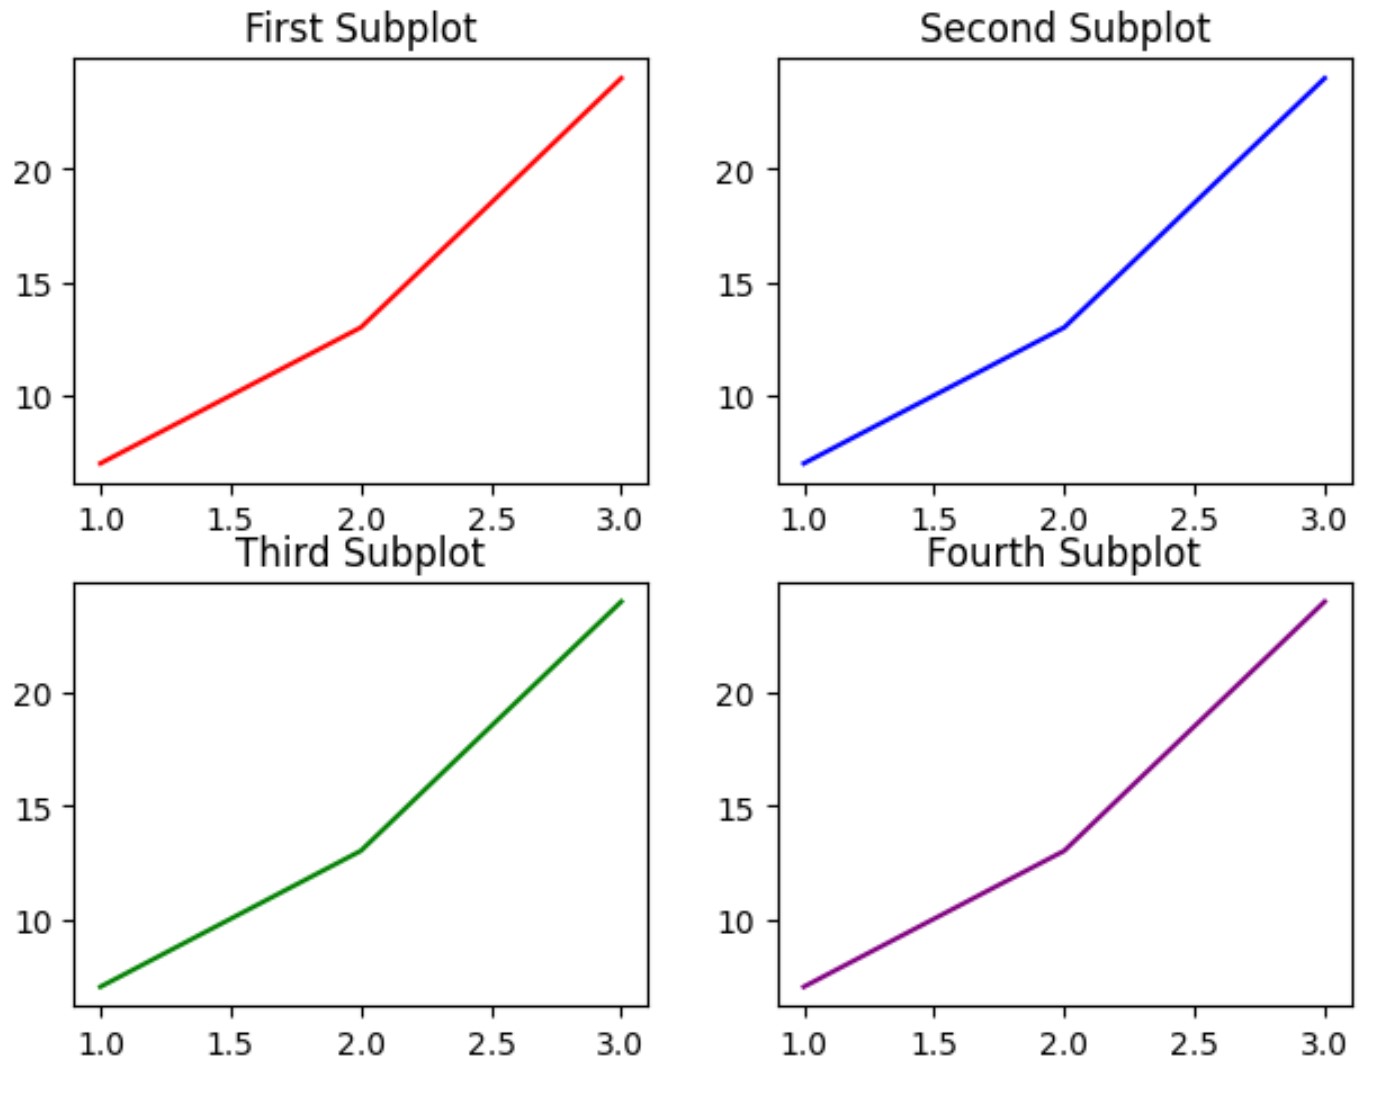
通过指定Fig.tight_layout(),我们可以自动调整子图之间和子图周围的填充:
 import matplotlib. pyplot as plt

#define data
x = [1, 2, 3]
y = [7, 13, 24]

#define layout for subplots
fig, ax = plt. subplots (2, 2)

#specify a tight layout
fig. tight_layout ()

#define subplot titles
ax[0, 0]. plot (x,y,color=' red ')
ax[0, 1]. plot (x,y,color=' blue ')
ax[1, 0]. plot (x,y,color=' green ')
ax[1, 1]. plot (x,y,color=' purple ')

#add title to each subplot
ax[0, 0]. set_title (' First Subplot ')
ax[0, 1]. set_title (' Second Subplot ')
ax[1, 0]. set_title (' Third Subplot ')
ax[1, 1]. set_title (' Fourth Subplot ')

请注意,子图之间和子图周围的填充已调整,以便图不再在任何区域重叠。
请注意, Tight_layout()函数采用pad参数来指定图窗边缘和子路径边缘之间的填充(作为字体大小的一部分)。
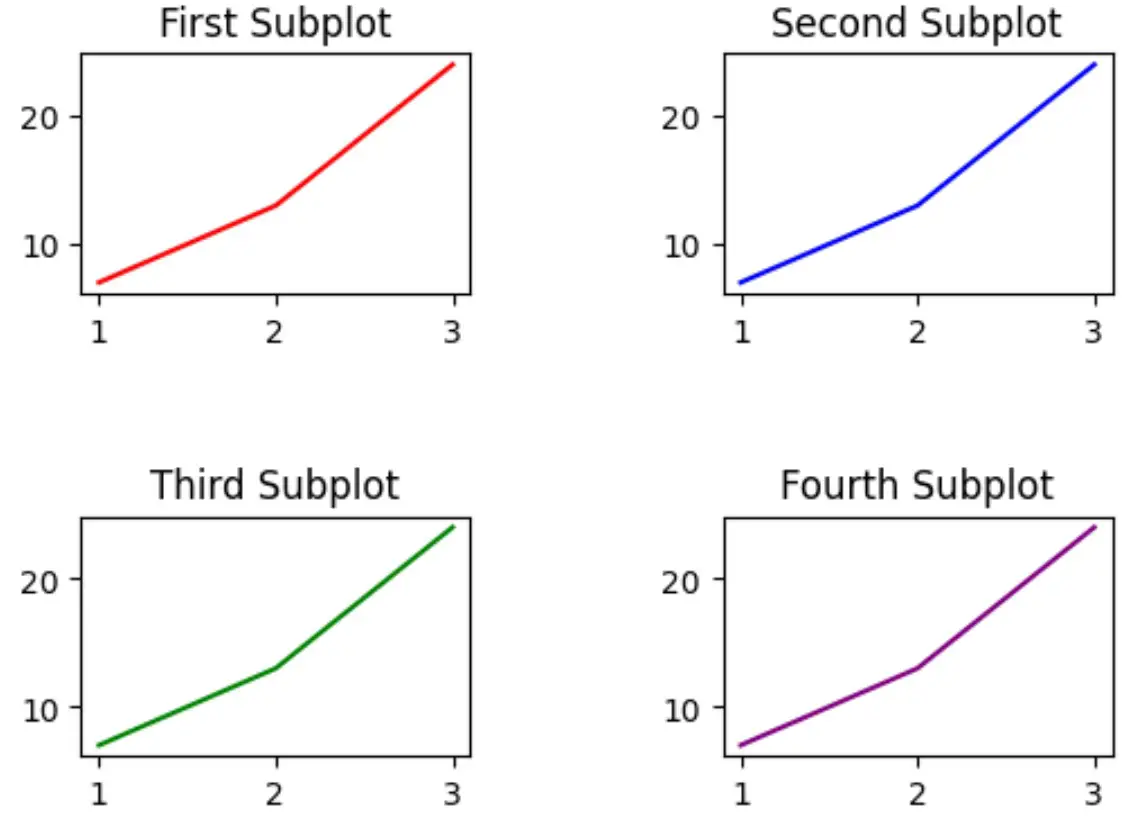
默认焊盘值为1.08 。但是,我们可以增加该值以增加路径周围的填充:
 import matplotlib. pyplot as plt

#define data
x = [1, 2, 3]
y = [7, 13, 24]

#define layout for subplots
fig, ax = plt. subplots (2, 2)

#specify a tight layout with increased padding
fig. tight_layout (pad=5)

#define subplot titles
ax[0, 0]. plot (x,y,color=' red ')
ax[0, 1]. plot (x,y,color=' blue ')
ax[1, 0]. plot (x,y,color=' green ')
ax[1, 1]. plot (x,y,color=' purple ')

#add title to each subplot
ax[0, 0]. set_title (' First Subplot ')
ax[0, 1]. set_title (' Second Subplot ')
ax[1, 0]. set_title (' Third Subplot ')
ax[1, 1]. set_title (' Fourth Subplot ')

请注意,地块周围的填充明显增加。
您可以随意调整pad参数的值,以根据需要增加路径周围的填充。
其他资源
以下教程解释了如何在 Matplotlib 中执行其他常见任务:
如何在 Matplotlib 中为子图添加标题
如何在 Matplotlib 中调整子图大小
如何调整 Matplotlib 子图之间的间距