如何在 matplotlib 中绘制平滑曲线
通常,您可能希望在 Matplotlib 中为折线图绘制平滑曲线。幸运的是,使用以下 SciPy 函数可以轻松做到这一点:
本教程解释了如何在实践中使用这些功能。
示例:在 Matplotlib 中绘制平滑曲线
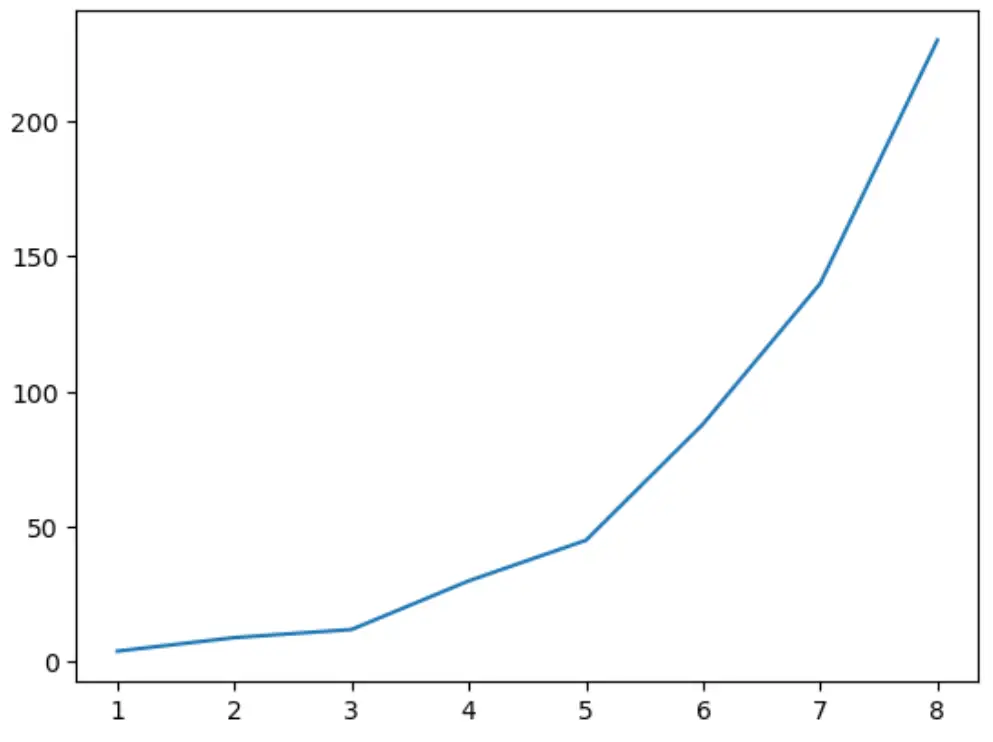
以下代码展示了如何为一组数据创建简单的折线图:
 import numpy as np
import matplotlib.pyplot as plt

#create data
x = np.array([1, 2, 3, 4, 5, 6, 7, 8])
y = np.array([4, 9, 12, 30, 45, 88, 140, 230])

#create line chart
plt. plot (x,y)
plt. show ()

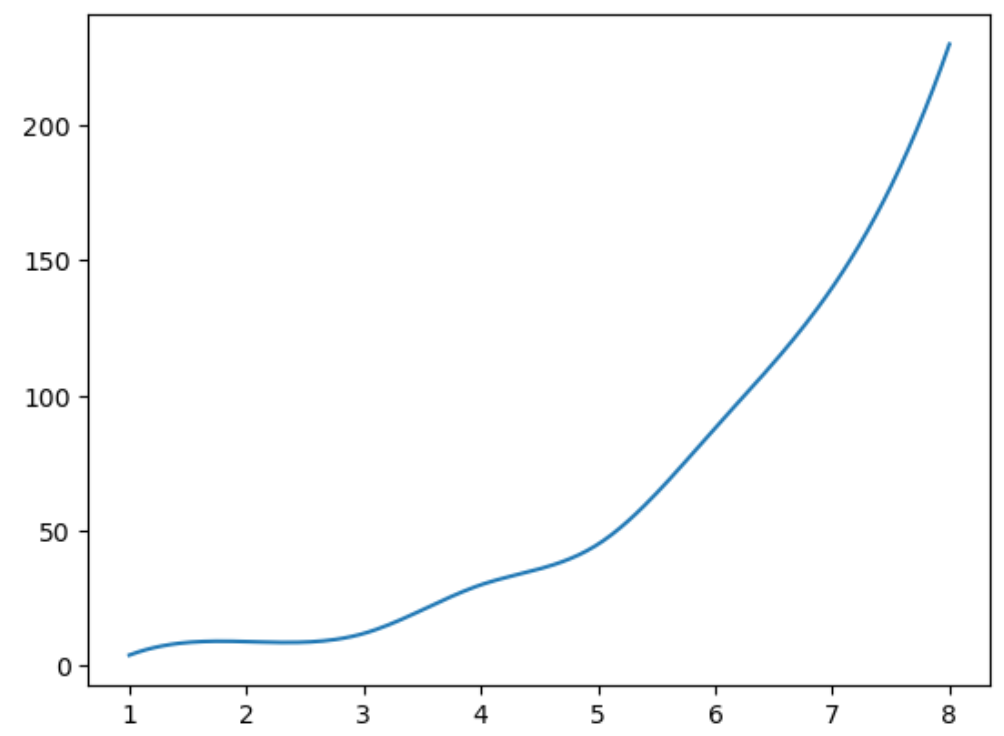
请注意,折线图并不完全平滑,因为基础数据并不遵循平滑线。我们可以使用以下代码为该数据集创建平滑曲线:
 from scipy.interpolate import make_interp_spline, BSpline

#createdata
x = np.array([1, 2, 3, 4, 5, 6, 7, 8])
y = np.array([4, 9, 12, 30, 45, 88, 140, 230])

#define x as 200 equally spaced values between the min and max of original x
xnew = np. linspace ( x.min (), x.max (), 200 )

#define spline
spl = make_interp_spline (x, y, k= 3 )
y_smooth = spl (xnew)

#create smooth line chart
plt. plot (xnew, y_smooth)
plt. show ()

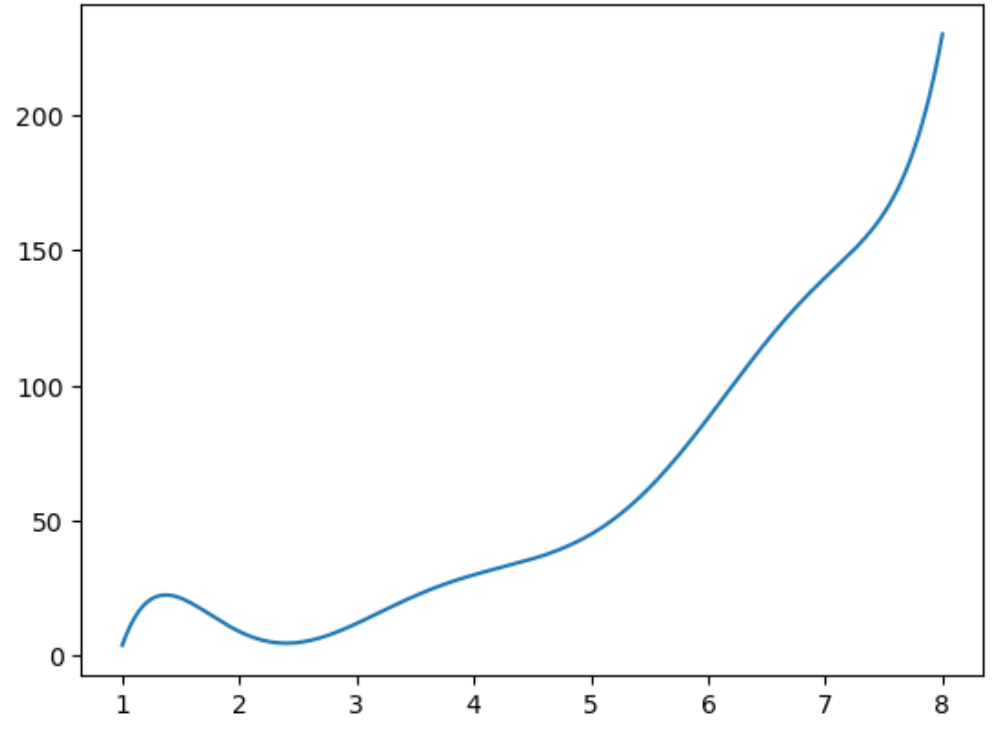
请注意, k参数使用的阶数越高,曲线就越“波动”。例如,考虑下图k=7 :
 from scipy.interpolate import make_interp_spline, BSpline

#createdata
x = np.array([1, 2, 3, 4, 5, 6, 7, 8])
y = np.array([4, 9, 12, 30, 45, 88, 140, 230])

#define x as 200 equally spaced values between the min and max of original x
xnew = np. linspace ( x.min (), x.max (), 200 )

#define spline with degree k=7
spl = make_interp_spline (x, y, k= 7 )
y_smooth = spl (xnew)

#create smooth line chart
plt. plot (xnew, y_smooth)
plt. show ()

根据您想要的线曲率,您可以更改 k 的值。
其他资源
如何在 Matplotlib 绘图上显示网格线
如何从 Matplotlib 图中删除刻度
如何创建具有对数刻度的 Matplotlib 图