如何更改 ggplot2 中的背景颜色(带有示例)
您可以使用以下语法更改 ggplot2 图中各种元素的背景颜色:
 p + theme(panel. background = element_rect(fill = ' lightblue ', color = ' purple '),
          panel. grid . major = element_line(color = ' red ', linetype = ' dotted '),
          panel. grid . minor = element_line(color = ' green ', size = 2 ))
您还可以使用内置的 ggplot2 主题自动更改背景颜色。以下是一些最常用的主题:
 p + theme_bw() #white background and gray gridlines
p + theme_minimal() #no background annotations
p + theme_classic() #axis lines but no gridlines
以下示例展示了如何在实践中使用此语法。
示例 1:指定自定义背景颜色
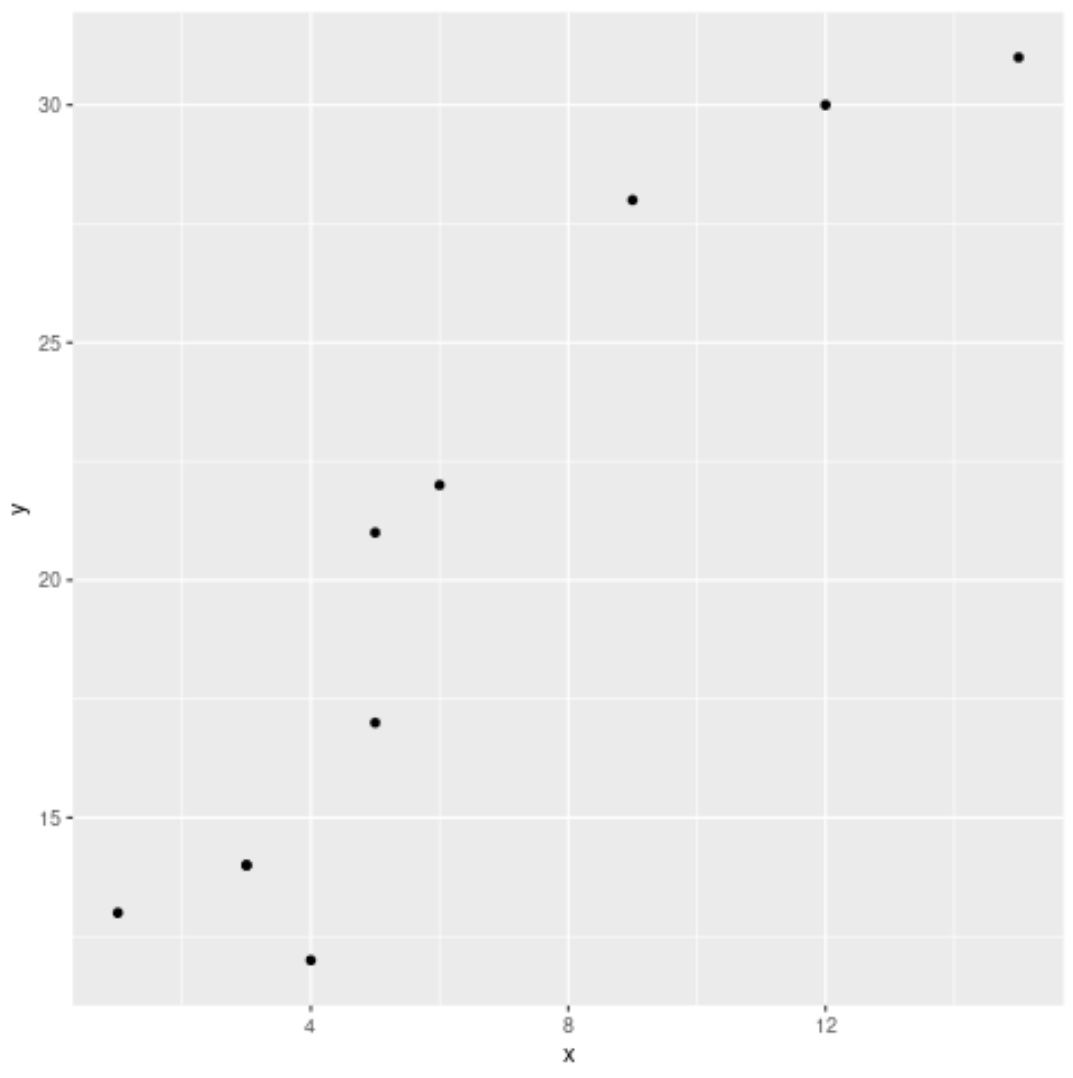
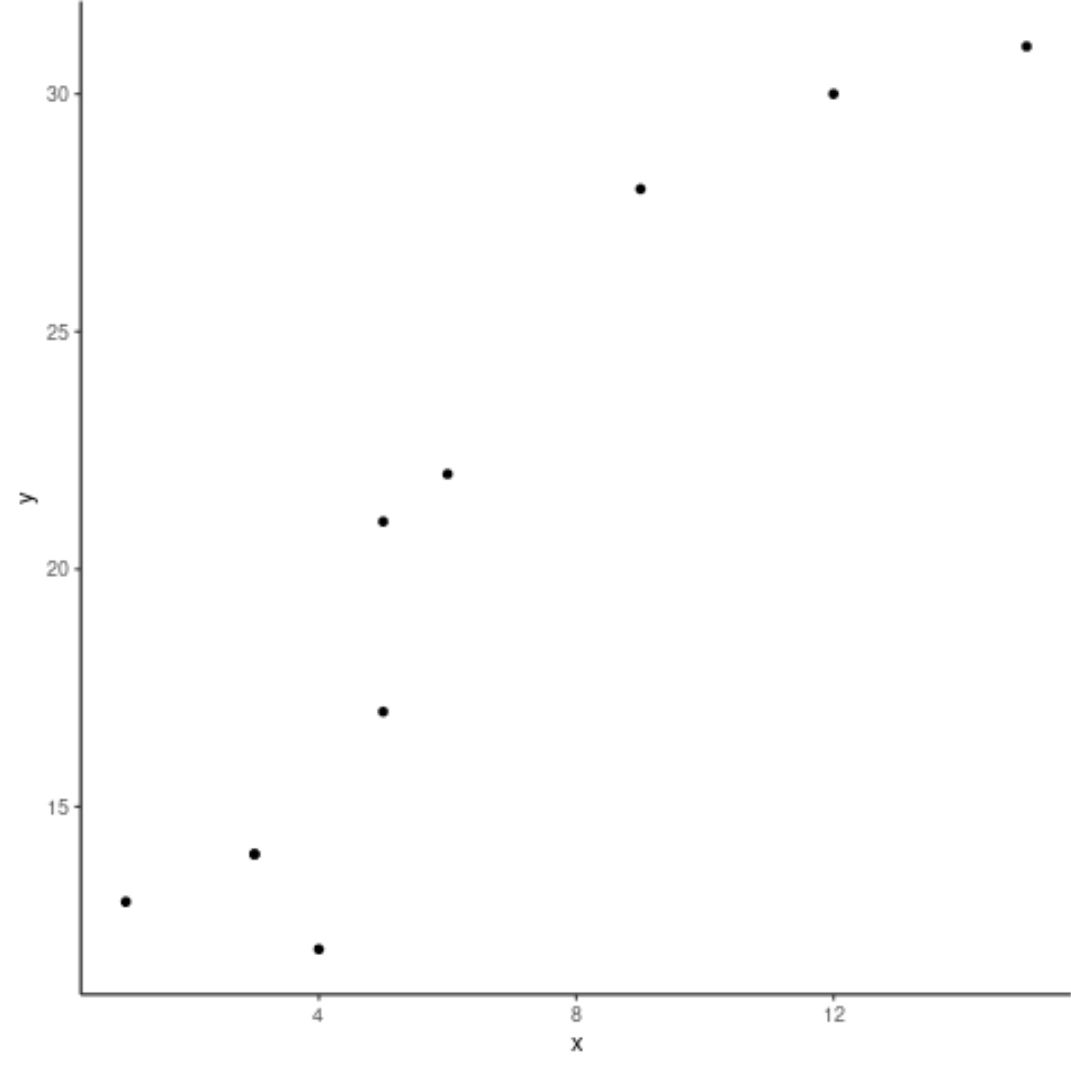
以下代码展示了如何在 ggplot2 中创建具有默认灰色背景的基本散点图:
 library (ggplot2)

#create data frame
df <- data. frame (x=c(1, 3, 3, 4, 5, 5, 6, 9, 12, 15),
                 y=c(13, 14, 14, 12, 17, 21, 22, 28, 30, 31))

#create scatterplot
p <- ggplot(df, aes (x=x, y=y)) +
       geom_point()

#display scatterplot
p
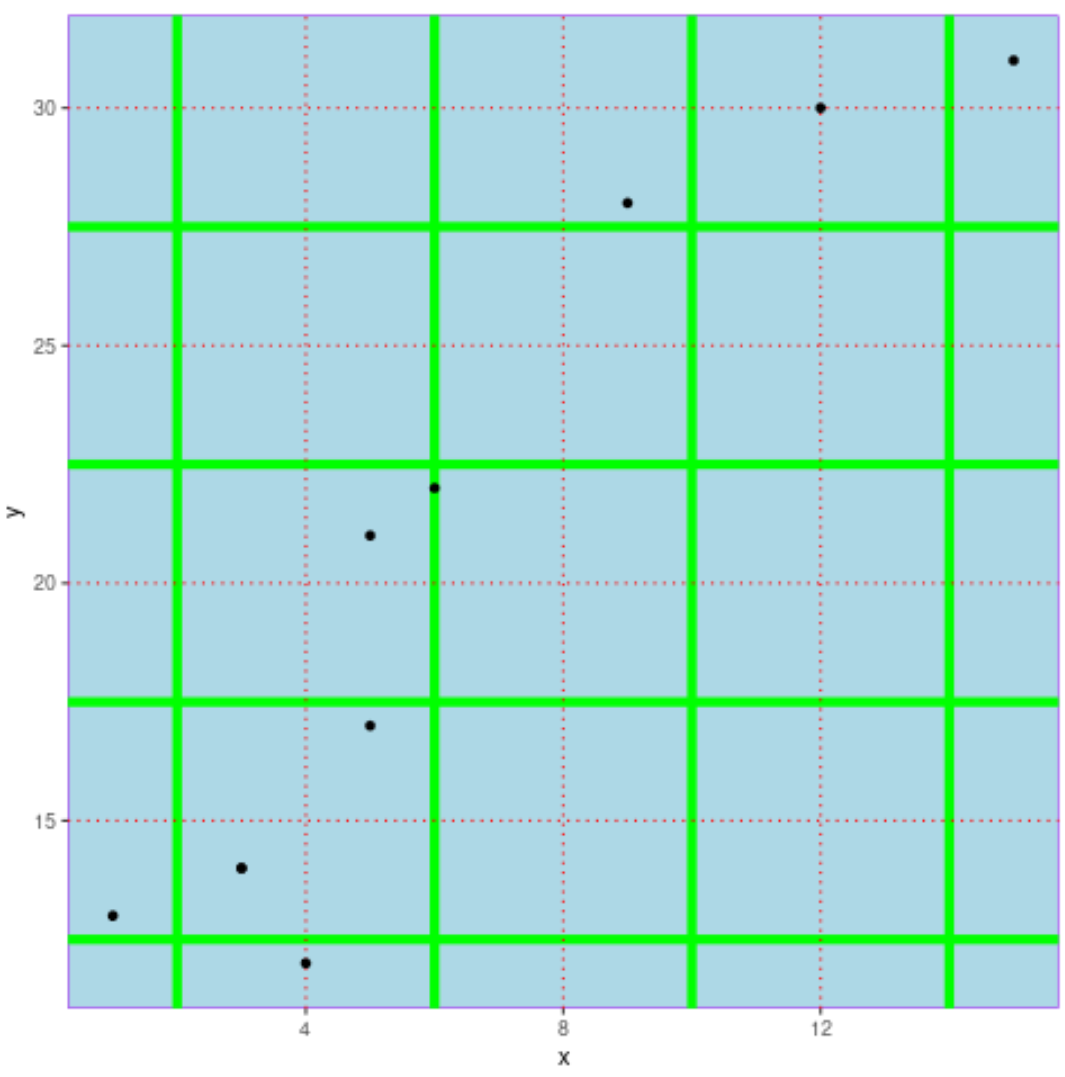
我们可以使用以下代码来更改面板的背景颜色以及主网格线和次网格线:
 p + theme(panel. background = element_rect(fill = ' lightblue ', color = ' purple '),
          panel. grid . major = element_line(color = ' red ', linetype = ' dotted '),
          panel. grid . minor = element_line(color = ' green ', size = 2 ))
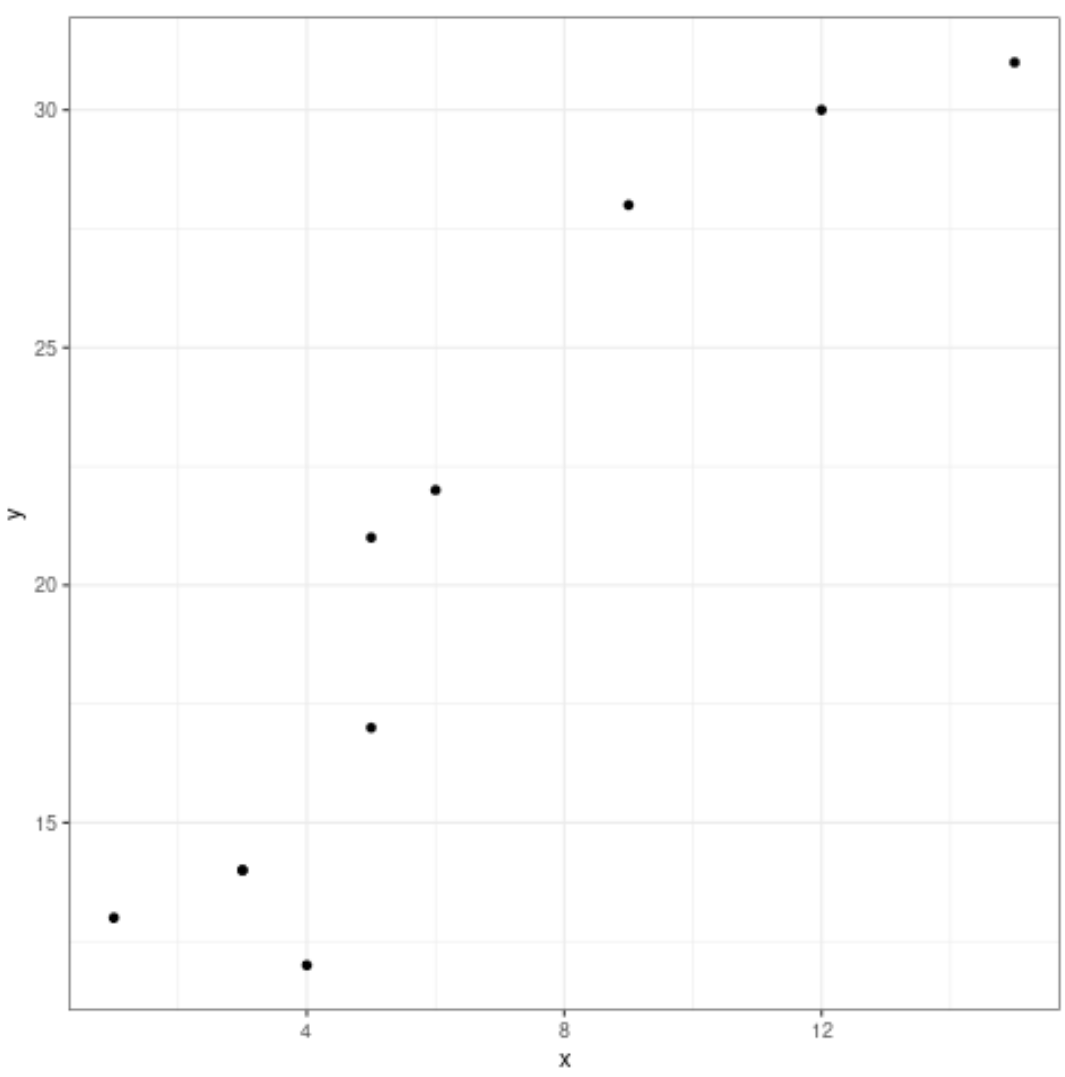
示例2:使用内置主题更改背景颜色
以下代码演示了如何使用各种内置的 ggplot2 主题自动更改绘图的背景颜色:
p + theme_bw() #white background and gray gridlines
p + theme_minimal() #no background annotations
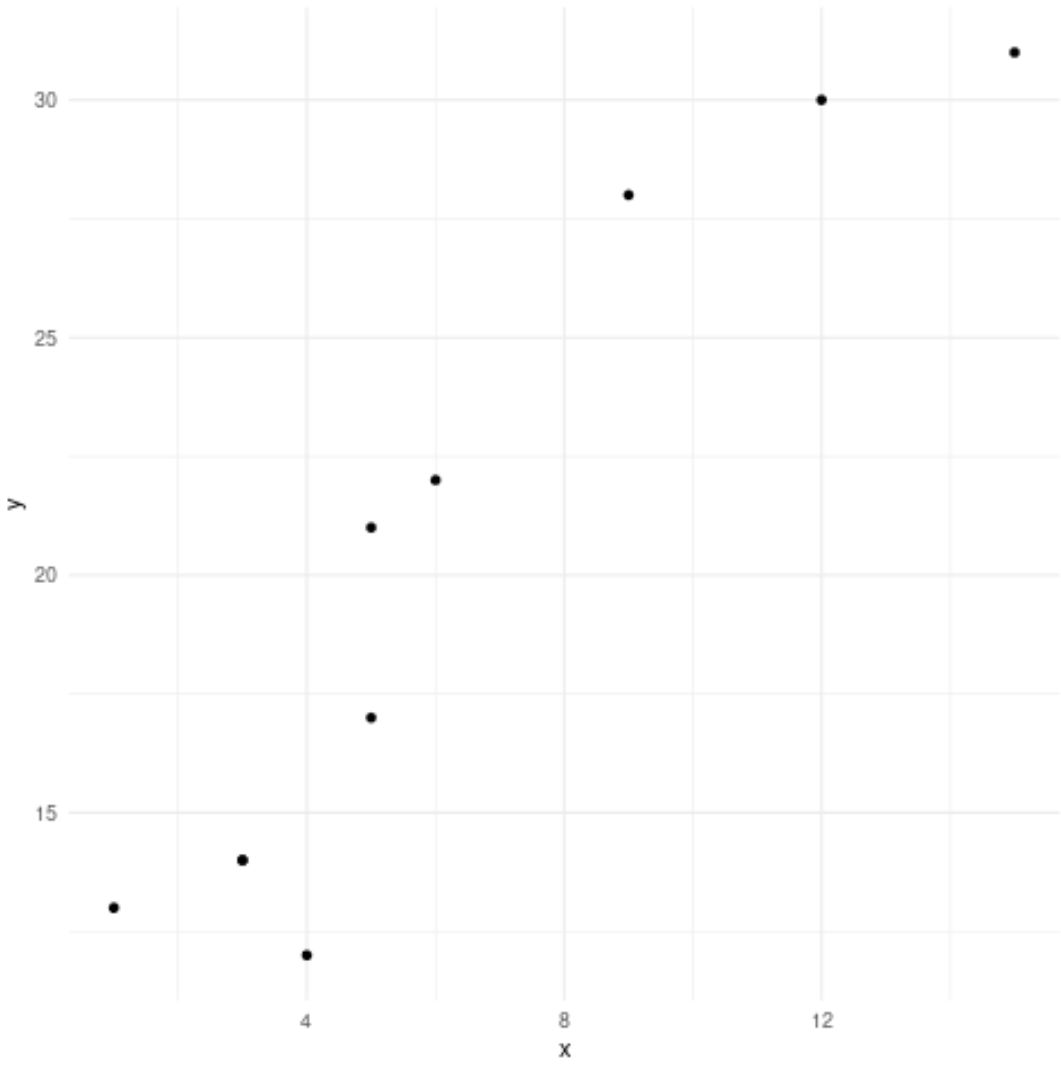
p + theme_classic() #axis lines but no gridlines
其他资源
如何删除ggplot2中的网格线
如何在ggplot2中设置轴限制
如何更改ggplot2中的图例位置
关于作者
本杰明·安德森博
大家好,我是本杰明,一位退休的统计学教授,后来成为 Statorials 的热心教师。 凭借在统计领域的丰富经验和专业知识,我渴望分享我的知识,通过 Statorials 增强学生的能力。了解更多