如何在 ggplot2 中绘制趋势线(附示例)
您可以使用以下基本语法在 ggplot2 中的绘图上绘制趋势线:
 ggplot(df, aes(x=xvar, y=yvar)) +
    geom_point() +
    geom_smooth(method=lm) #add linear trend line
以下示例展示了如何在实践中使用以下数据框使用此语法:
 #create data frame
df <- data. frame (x=c(1, 2, 3, 3, 5, 7, 9),
                 y=c(8, 14, 18, 25, 29, 33, 25))

#view data frame
df

  xy
1 1 8
2 2 14
3 3 18
4 3 25
5 5 29
6 7 33
7 9 25
示例 1:添加线性趋势线
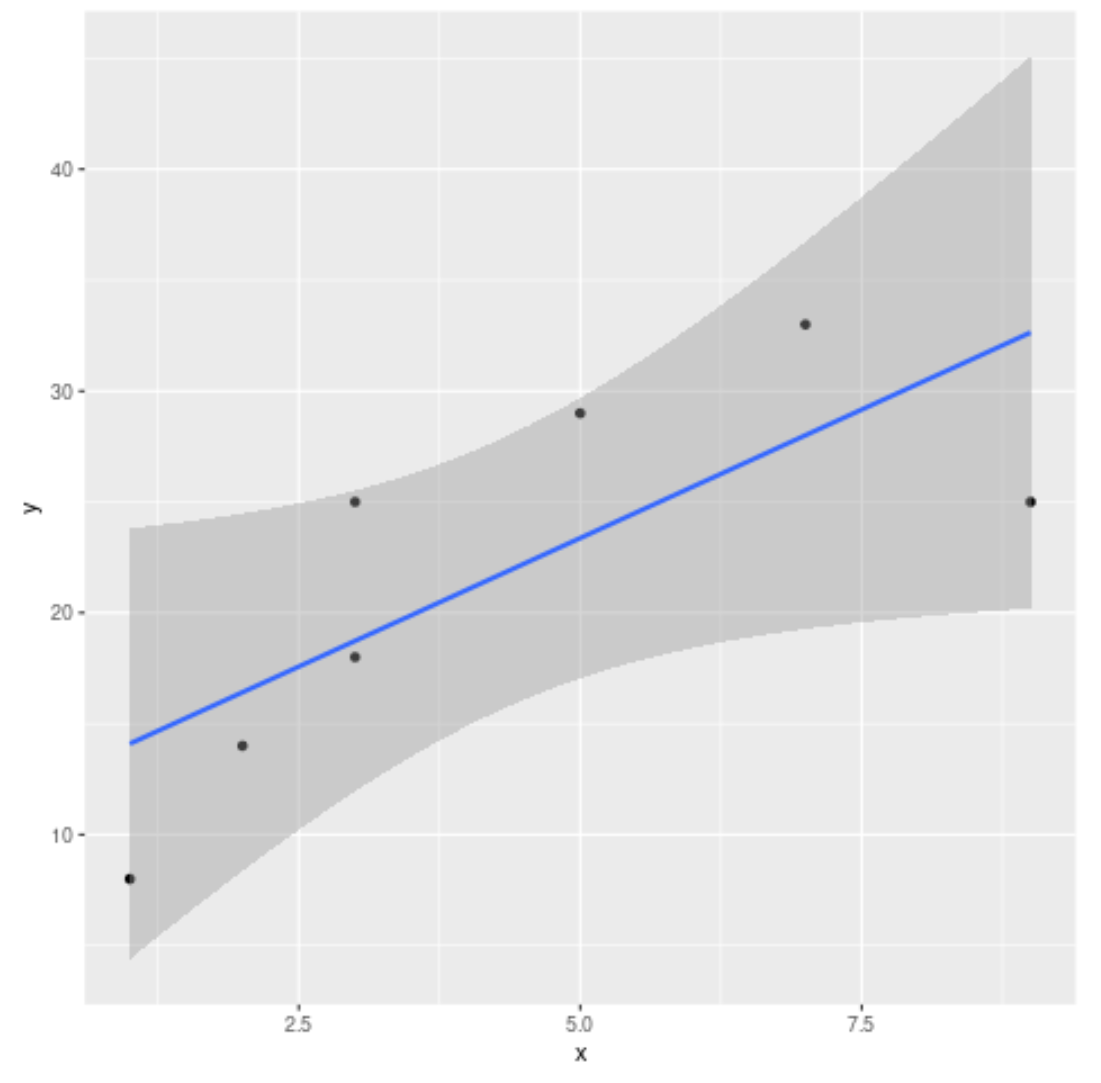
以下代码展示了如何向 ggplot2 中的散点图添加线性趋势线:
 library (ggplot2)

ggplot(df, aes(x=x, y=y)) +
    geom_point() +
    geom_smooth(method=lm) #add linear trend line
示例 2:添加线性趋势线并指定置信区域
我们可以使用level参数来指定用于图中阴影置信区域的置信水平:
 library (ggplot2)

ggplot(df, aes(x=x, y=y)) +
    geom_point() +
    geom_smooth(method=lm, level= 0.99 )
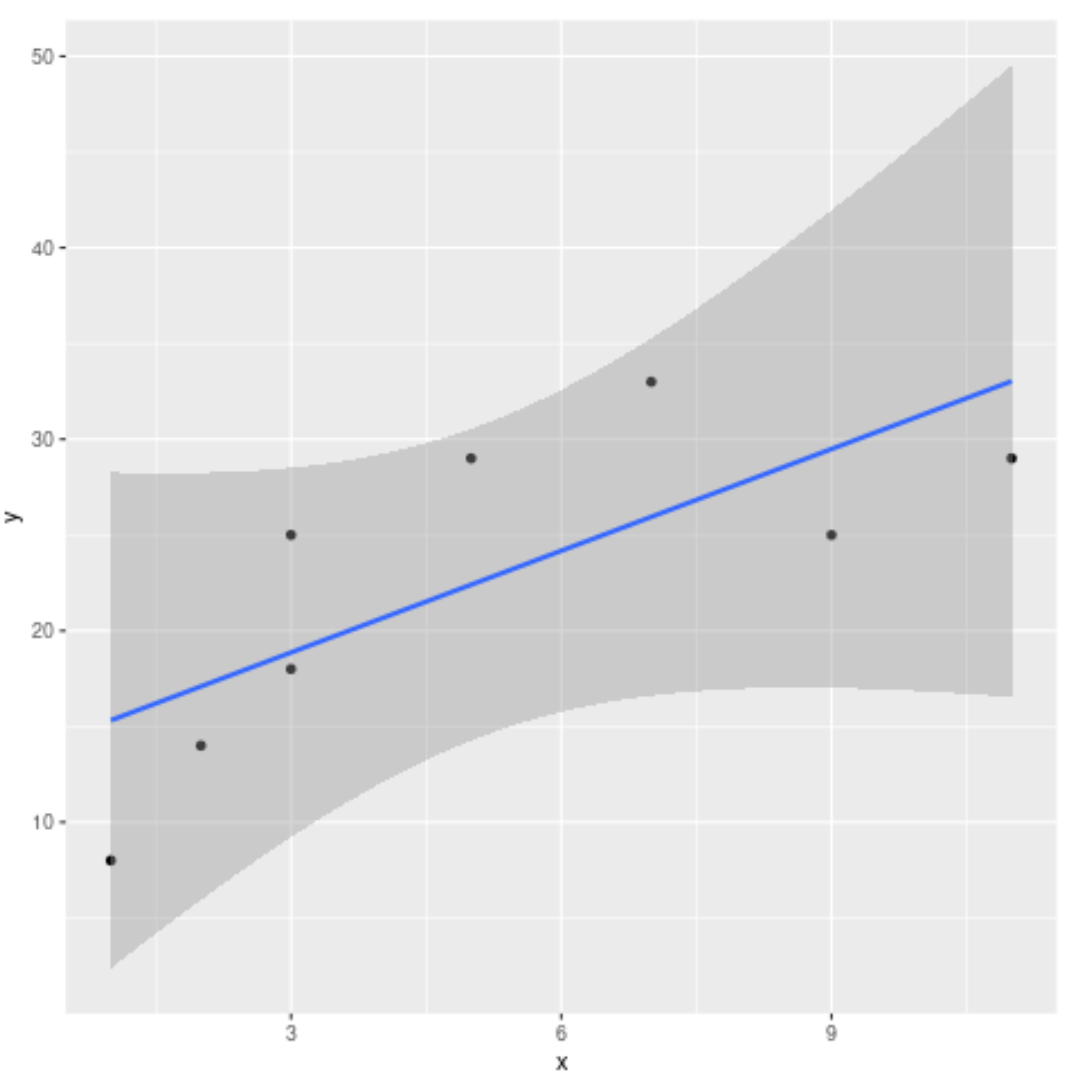
请注意,默认置信水平为 0.95。通过指定 0.99 的置信水平,图表上的阴影置信区域变得更大。
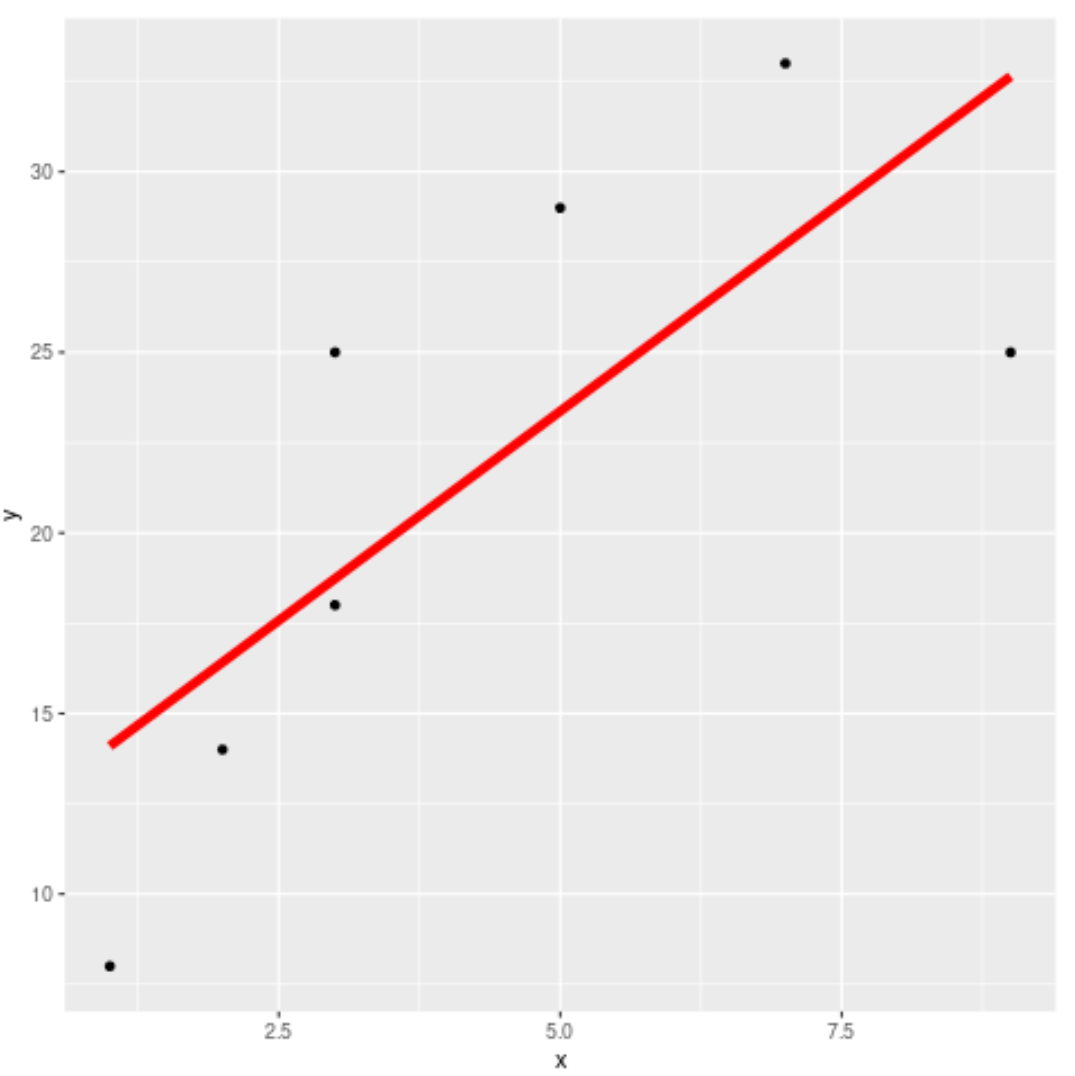
示例 3:添加线性趋势线和无置信区域
我们可以使用se=FALSE参数来隐藏趋势线周围的阴影置信区域:
 library (ggplot2)

ggplot(df, aes(x=x, y=y)) +
    geom_point() +
    geom_smooth(method=lm, se= FALSE , col=' red ', size= 2 )
示例 4:添加曲线趋势线
如果我们没有指定geom_smooth()使用的方法,则默认情况下将使用黄土曲线:
 library (ggplot2)

ggplot(df, aes(x=x, y=y)) +
    geom_point() +
    geom_smooth()
您可以 在此处找到geom_smooth()函数的完整在线文档。
其他资源
以下教程解释了如何在ggplot2中执行其他常用操作:
ggplot2中如何调整线条粗细
如何在ggplot2中设置轴限制
如何删除ggplot2中的网格线
如何更改ggplot2中的背景颜色
关于作者
本杰明·安德森博
大家好,我是本杰明,一位退休的统计学教授,后来成为 Statorials 的热心教师。 凭借在统计领域的丰富经验和专业知识,我渴望分享我的知识,通过 Statorials 增强学生的能力。了解更多