如何反转 ggplot2 中的轴顺序(带有示例)
您可以使用scale_y_reverse()和scale_x_reverse()函数快速反转ggplot2中轴的顺序。
这些函数使用以下基本语法:
 ggplot(df, aes(x, y)) +
  geom_point() +
  scale_y_reverse()
您还可以在这些函数中使用Limits参数来在翻转轴后指定新的轴限制:
 ggplot(df, aes(x, y)) +
  geom_point() +
  scale_y_reverse (limits=c( 100,50 ))
下面的例子展示了如何在实践中使用这些函数。
示例:ggplot2 中轴的相反顺序
以下代码展示了如何在 ggplot2 中创建具有法线轴的散点图:
 library (ggplot2)

#create data frame
df <- data. frame (hours=c(1, 2, 2, 3, 4, 6, 7, 7, 8, 9),
                 score=c(76, 77, 75, 79, 84, 88, 85, 94, 95, 90))

#create scatter plot with normal y-axis
ggplot(df, aes(x=hours, y=score)) +
  geom_point(size= 2 )
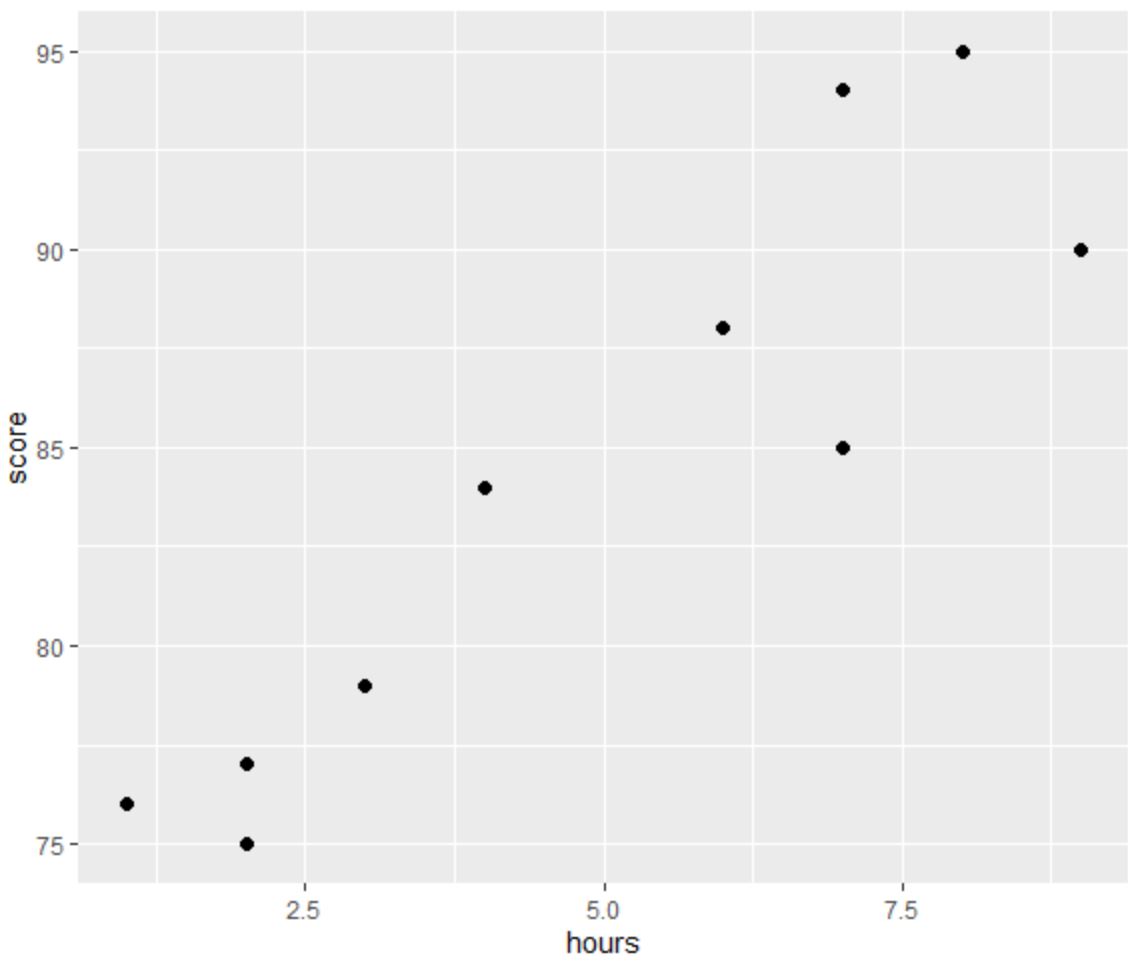
请注意,y 轴当前从 75 到 95。
以下代码展示了如何使用scale_y_reverse()函数反转y轴上的值的顺序:
 library (ggplot2)

#create data frame
df <- data. frame (hours=c(1, 2, 2, 3, 4, 6, 7, 7, 8, 9),
                 score=c(76, 77, 75, 79, 84, 88, 85, 94, 95, 90))

#create scatter plot with reversed y-axis
ggplot(df, aes(x=hours, y=score)) +
  geom_point(size= 2 ) +
  scale_y_reverse()
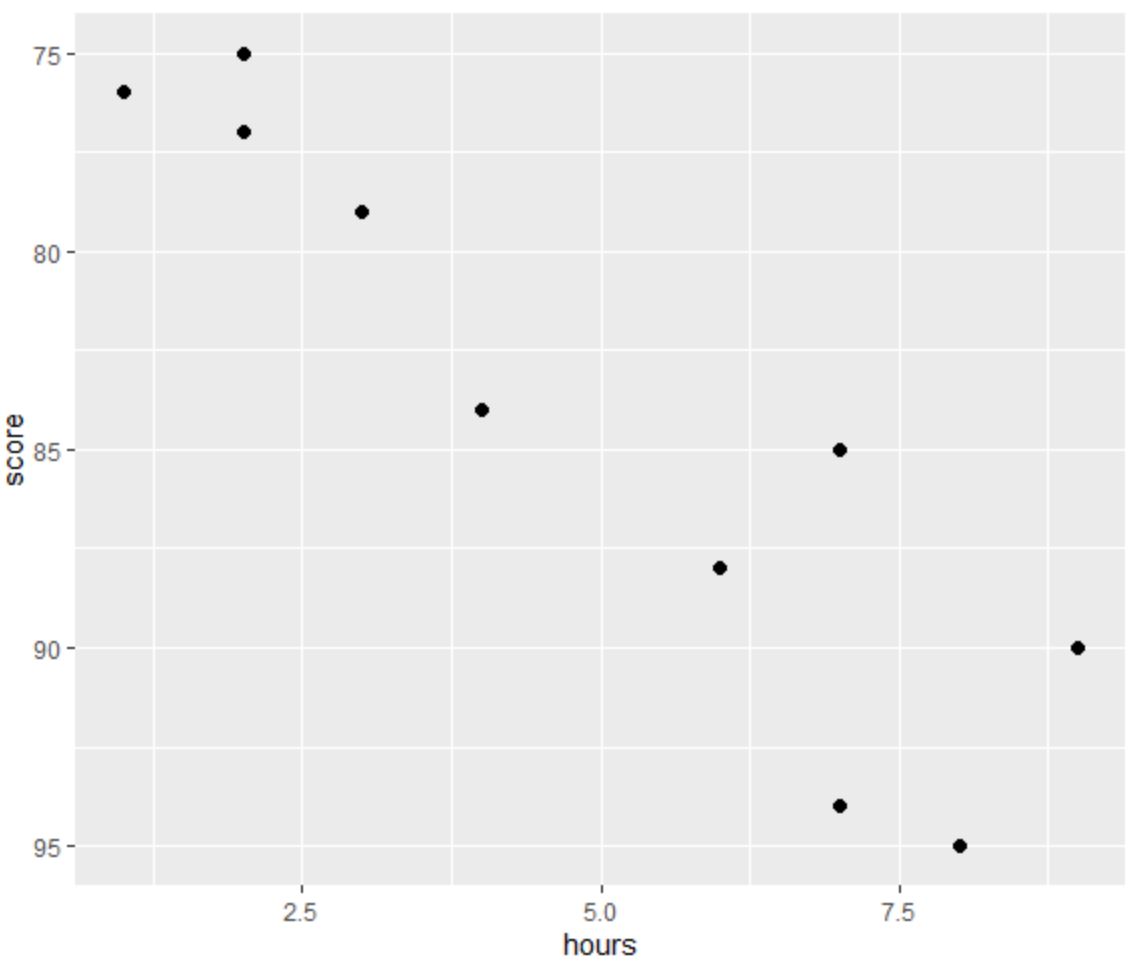
请注意,y 轴现在从 95 变为 75。
我们还可以使用scale_y_reverse()函数中的limits参数来更改y轴限制:
 library (ggplot2)

#create data frame
df <- data. frame (hours=c(1, 2, 2, 3, 4, 6, 7, 7, 8, 9),
                 score=c(76, 77, 75, 79, 84, 88, 85, 94, 95, 90))

#create scatter plot with reversed y-axis and modified limits
ggplot(df, aes(x=hours, y=score)) +
  geom_point(size= 2 ) +
  scale_y_reverse (limits=c( 100,50 ))
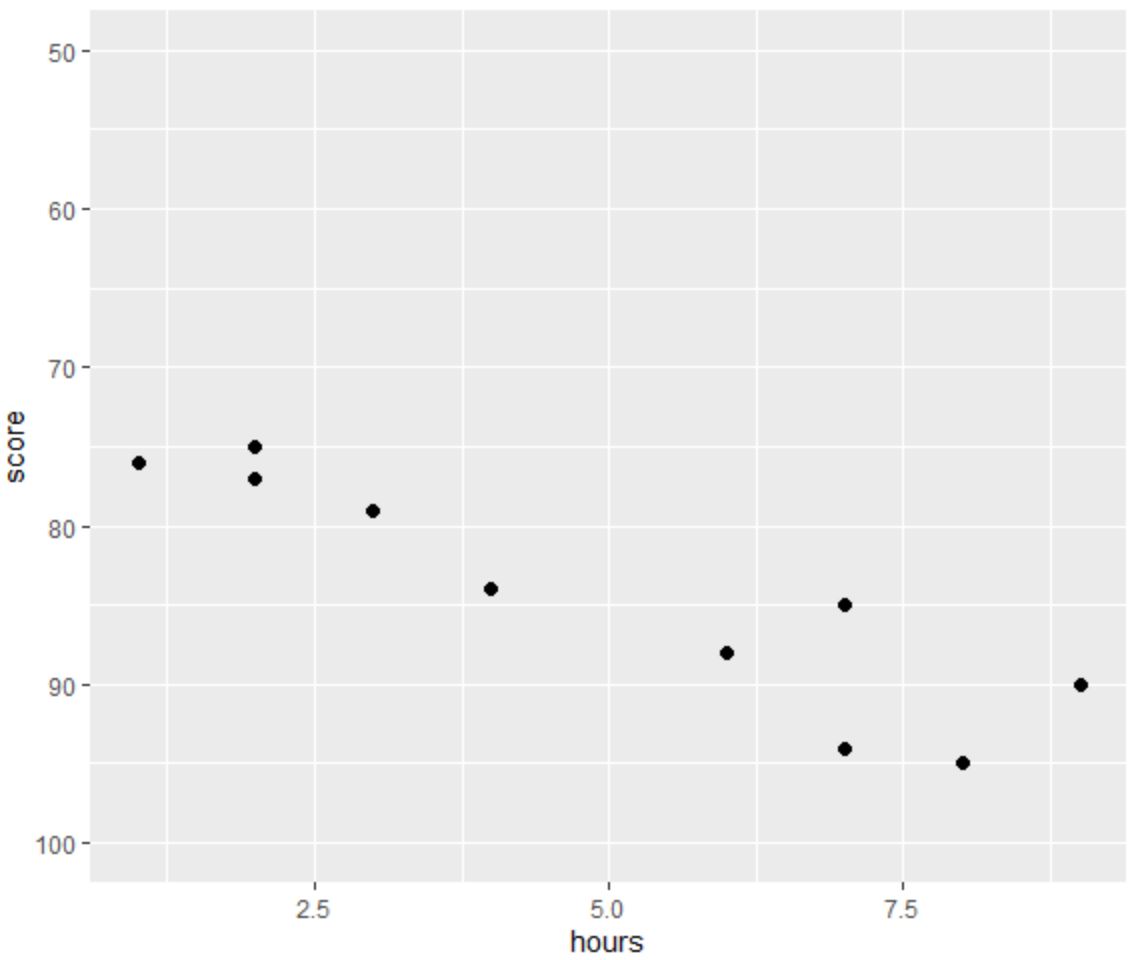
请注意,y 轴现在从 100 变为 50。
其他资源
以下教程解释了如何在 ggplot2 中执行其他常见任务:
如何在ggplot2中旋转轴标签
如何在ggplot2中设置轴中断
如何在ggplot2中设置轴限制
如何更改ggplot2中的图例标签
关于作者
本杰明·安德森博
大家好,我是本杰明,一位退休的统计学教授,后来成为 Statorials 的热心教师。 凭借在统计领域的丰富经验和专业知识,我渴望分享我的知识,通过 Statorials 增强学生的能力。了解更多