如何在 ggplot2 中编辑图例标签(附示例)
您可以使用以下语法更改 ggplot2 中的图例标签:
p + scale_fill_discrete(labels=c(' label1 ', ' label2 ', ' label3 ', ...))
以下示例展示了如何在实践中使用此语法。
示例:在 ggplot2 中编辑图例标签
假设我们在 ggplot2 中创建以下分组箱线图:
 library (ggplot2)

#make this example reproducible
set. seeds (1)

#create dataset
data <- data. frame (team=rep(c(' A ', ' B ', ' C '), each= 50 ),
                   program=rep(c(' low ', ' high '), each= 25 ),
                   values=seq(1:150)+sample(1:100, 150, replace= TRUE ))

#create grouped boxplots
p <- ggplot(data, aes (x=team, y=values, fill=program)) +
       geom_boxplot()

#display grouped boxplots
p
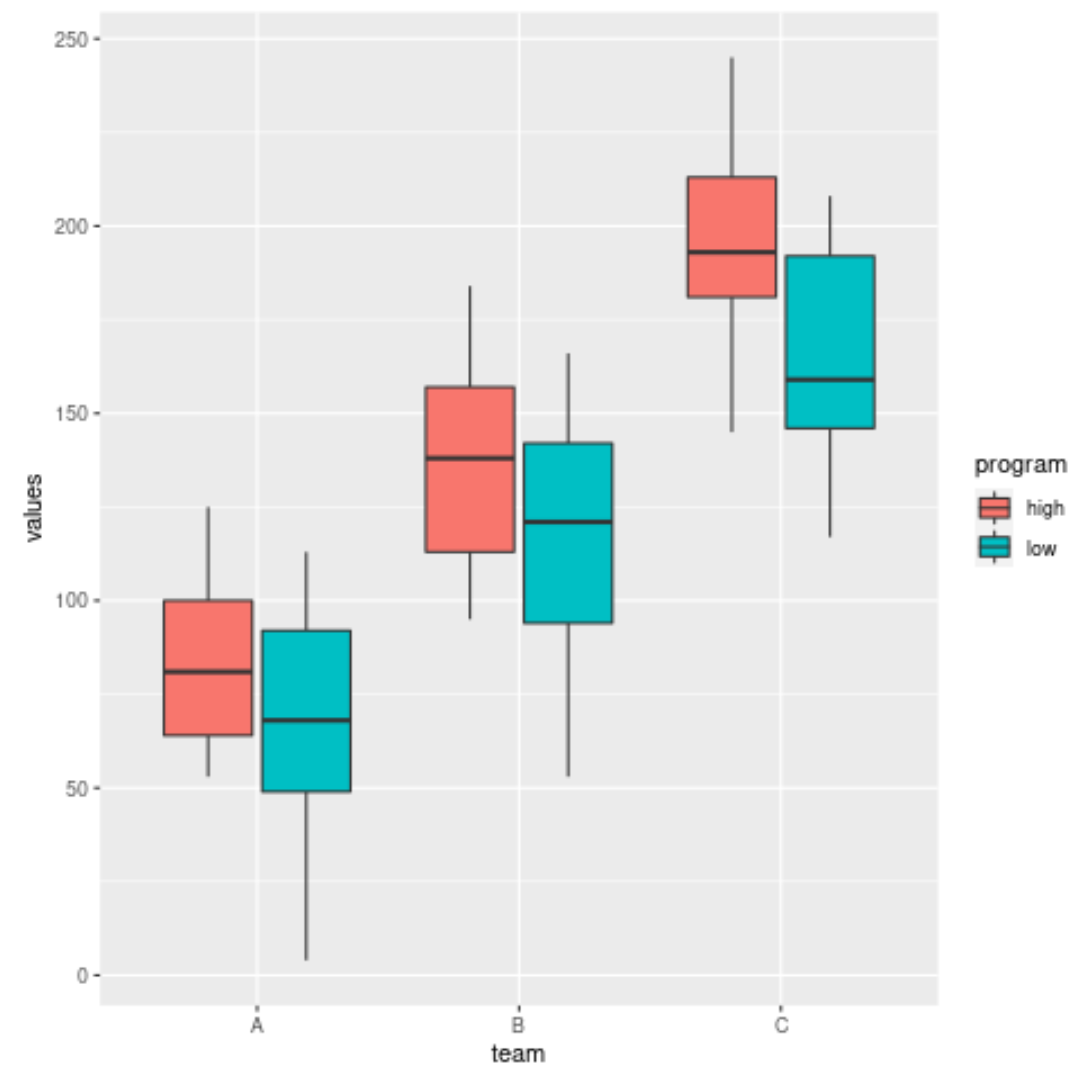
默认情况下,图例标签的填充变量采用以下值:
- 高的
- 虚弱的
但是,假设我们想将图例标签替换为:
- 高程序
- 低程序
我们可以使用以下语法来做到这一点:
 #create grouped boxplots with custom legend labels
p <- ggplot(data, aes (x=team, y=values, fill=program)) +
       geom_boxplot() +
       scale_fill_discrete(labels=c(' High Program ', ' Low Program '))

#display grouped boxplots
p
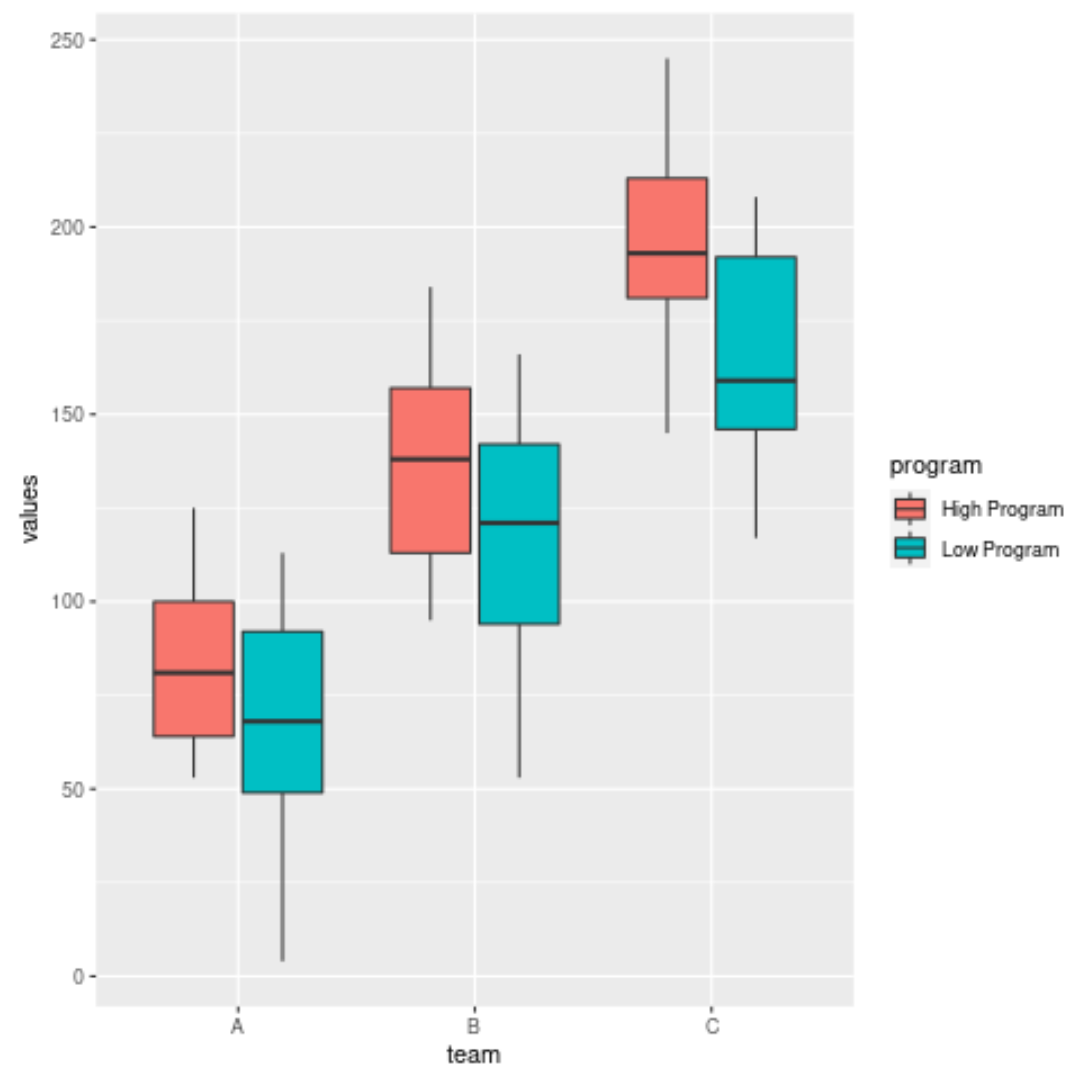
图例现在显示我们指定的标签。
其他资源
以下教程解释了如何在 ggplot2 中执行其他常见任务:
如何更改ggplot2中的图例标题
如何更改ggplot2中的图例位置
如何更改ggplot2中的图例大小
如何删除ggplot2中的图例
关于作者
本杰明·安德森博
大家好,我是本杰明,一位退休的统计学教授,后来成为 Statorials 的热心教师。 凭借在统计领域的丰富经验和专业知识,我渴望分享我的知识,通过 Statorials 增强学生的能力。了解更多