如何更改ggplot2中图例项之间的间距
您可以使用以下方法来更改 ggplot2 中图例元素之间的间距:
方法 1:更改水平间距
 p+
  theme(legend. spacing . x = unit(1, ' cm '))
方法 2:更改垂直间距
 p+
  theme(legend. spacing . y = unit(1, ' cm ')) +
  guides(fill = guide_legend(byrow = TRUE ))
以下示例展示了如何在实践中使用以下数据框使用每种方法:
 #create data frame
df <- data. frame (team=c('Mavs', 'Heat', 'Nets', 'Lakers', 'Suns', 'Cavs'),
                 points=c(24, 20, 34, 39, 28, 29),
                 assists=c(5, 7, 6, 9, 12, 13))

#view data frame
df

    team points assists
1 Mavs 24 5
2 Heat 20 7
3 Nets 34 6
4 Lakers 39 9
5 Suns 28 12
6 Cavs 29 13
示例 1:更改图例元素之间的水平间距
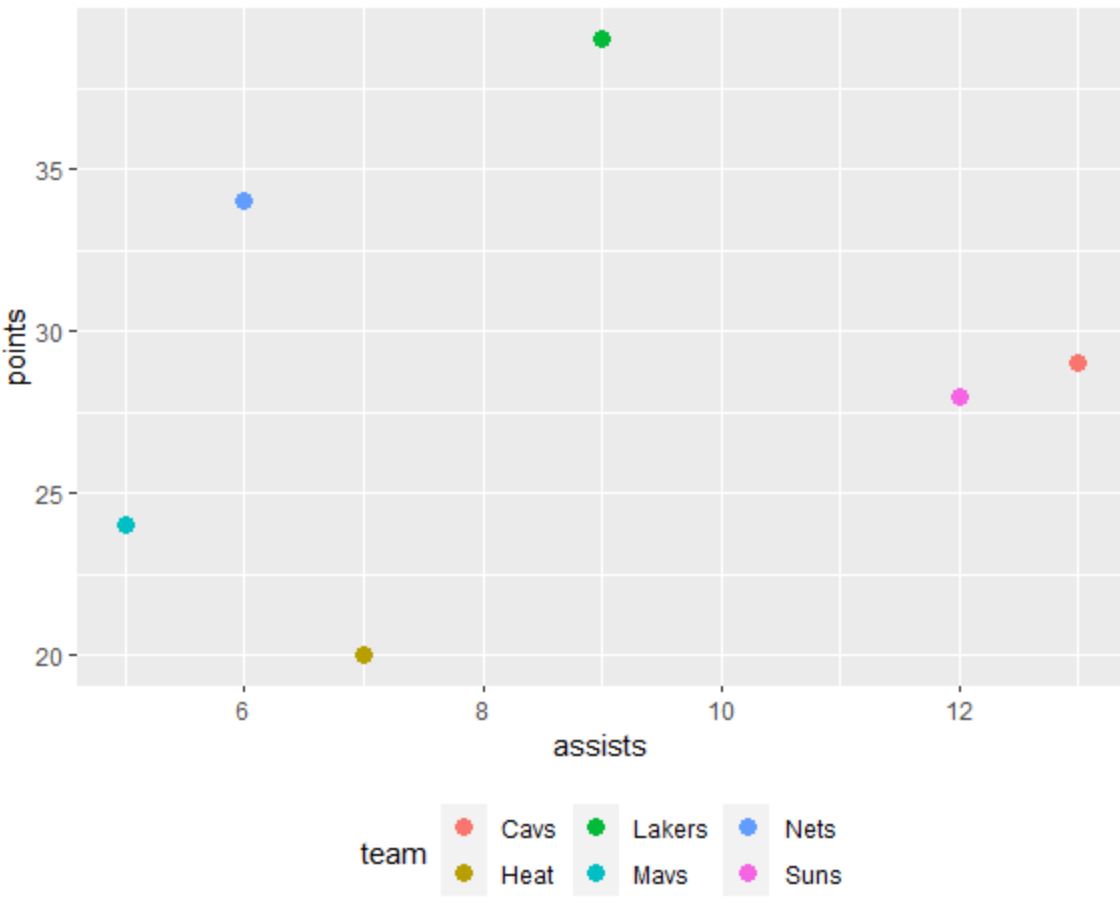
以下代码展示了如何在 ggplot2 中创建具有默认间距的水平图例的散点图:
 library (ggplot2)

#create scatterplot with default spacing in legend
ggplot(df, aes(x=assists, y=points, color=team)) +
  geom_point(size= 3 ) +
  theme(legend. position = ' bottom ')

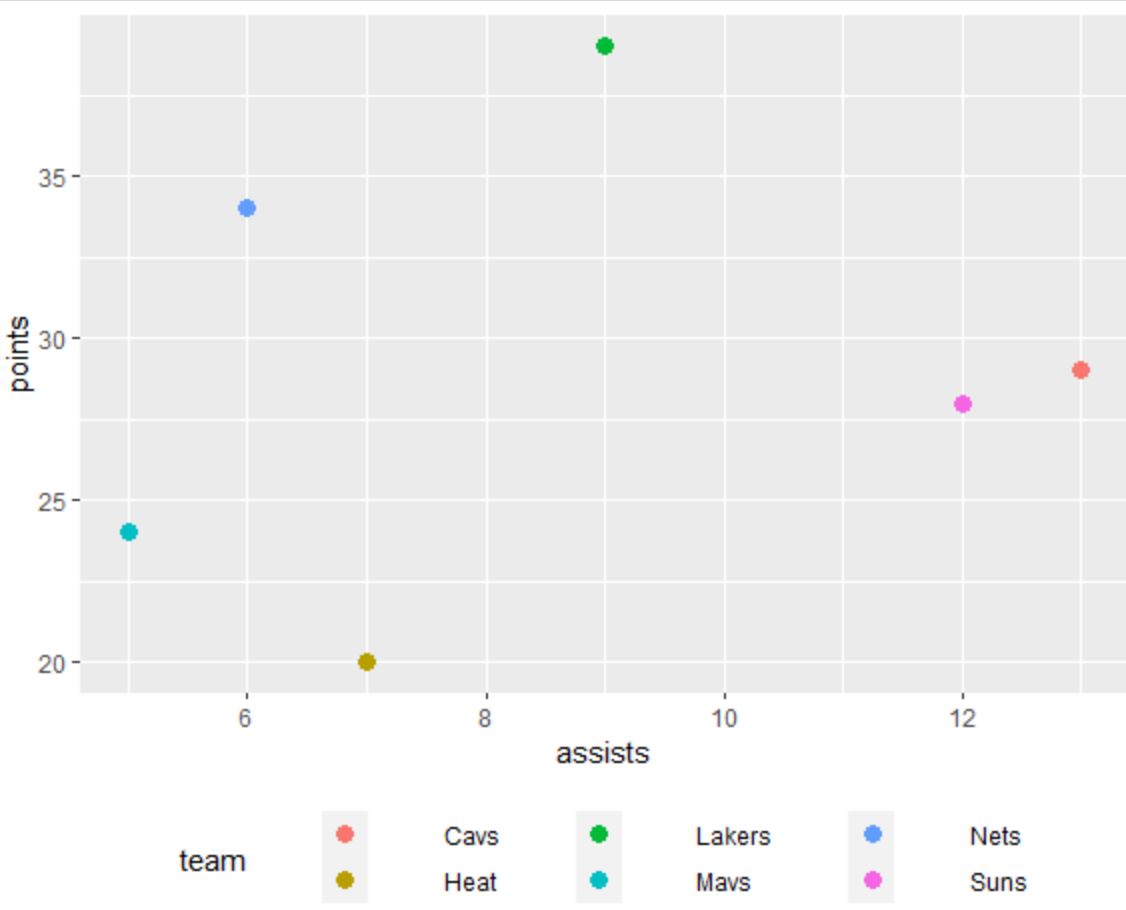
要增加图例元素之间的水平间距,我们可以使用legend.spacing.x参数:
 library (ggplot2)

#create scatterplot with increased horizontal spacing in legend
ggplot(df, aes(x=assists, y=points, color=team)) +
  geom_point(size= 3 ) +
  theme(legend. position = ' bottom ',
        legend. spacing . x = unit(1, ' cm '))

请注意,图例元素之间的水平间距已增加。
在unit()函数中使用的值越大,元素之间的间距就越大。
示例 2:更改标题元素之间的垂直间距
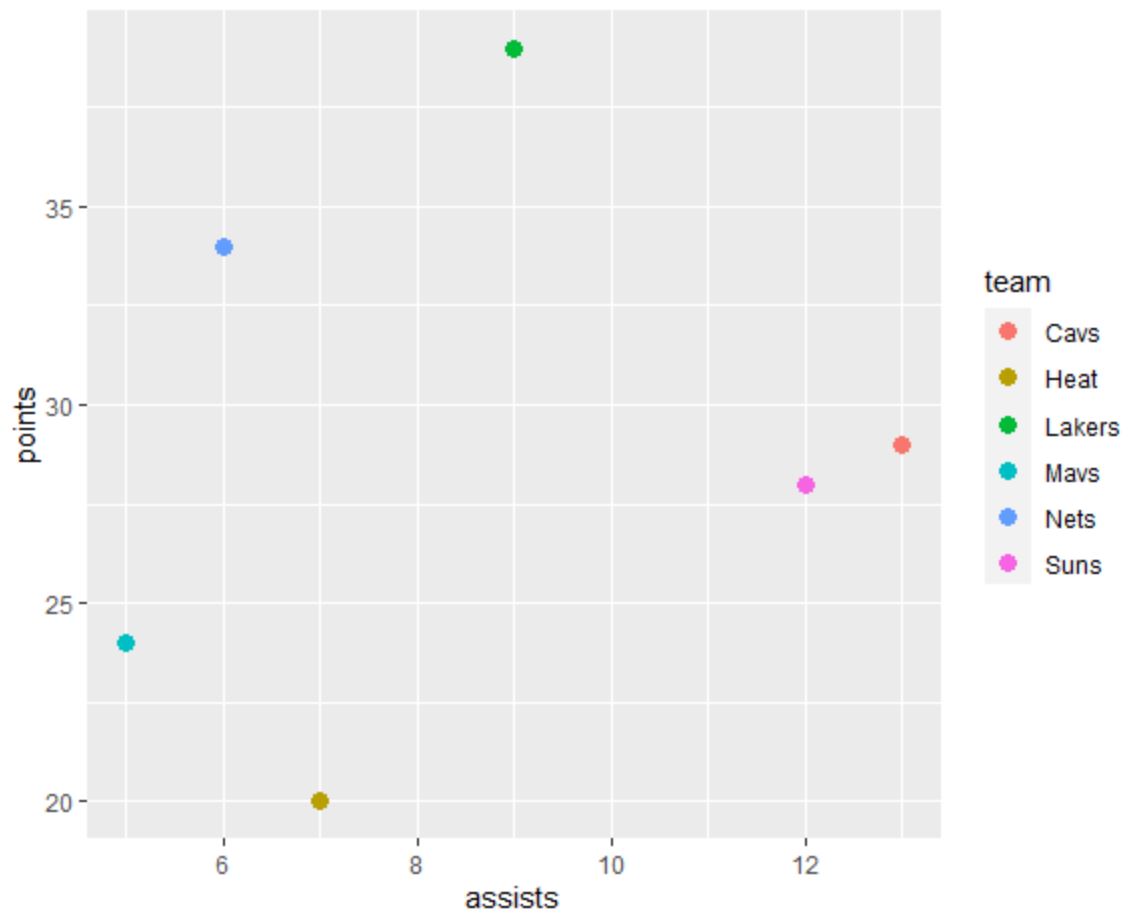
以下代码展示了如何在 ggplot2 中创建具有默认间距的垂直图例的散点图:
 library (ggplot2)

#create scatterplot with default spacing in legend
ggplot(df, aes(x=assists, y=points, color=team)) +
  geom_point(size= 3 )

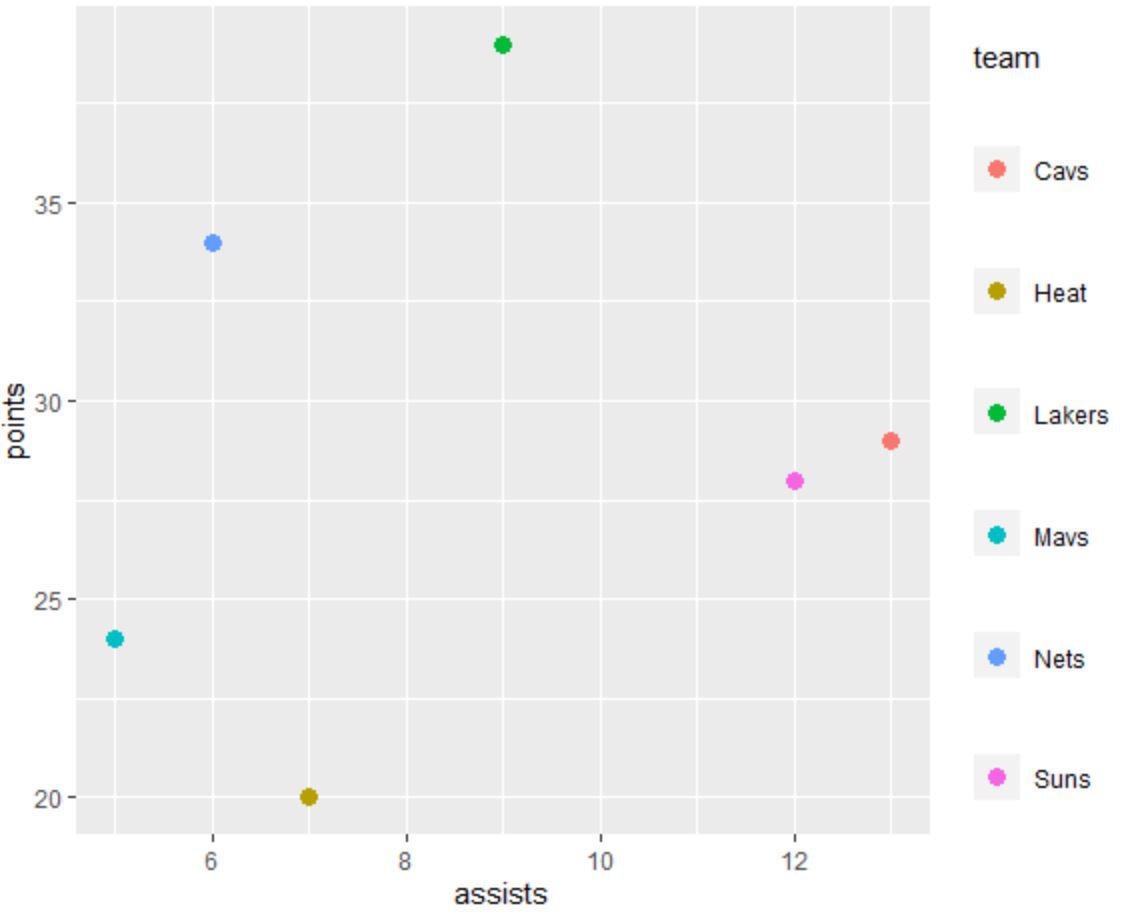
要增加图例元素之间的垂直间距,我们可以使用legend.spacing.y参数:
 library (ggplot2)

#create scatterplot with increased vertical spacing in legend
ggplot(df, aes(x=assists, y=points, color=team)) +
  geom_point(size= 3 ) +
  theme(legend. spacing . y = unit(1, ' cm ')) +
  guides(fill = guide_legend(byrow = TRUE ))

请注意,图例元素之间的垂直间距已增加。
在unit()函数中使用的值越大,元素之间的间距就越大。
注意:您必须包含使用byrow = TRUE参数的最后一行,否则图例元素将不会按预期间隔。
其他资源
以下教程解释了如何在ggplot2中执行其他常见操作: