如何在 ggplot2 中创建手动图例(带有示例)
通常,您可能希望使用自定义颜色、标签、标题等向 ggplot2 中的绘图添加手动图例。
幸运的是,使用scale_color_manual()函数可以很简单地做到这一点,下面的示例展示了如何做到这一点。
示例:在 ggplot2 中创建手动图例
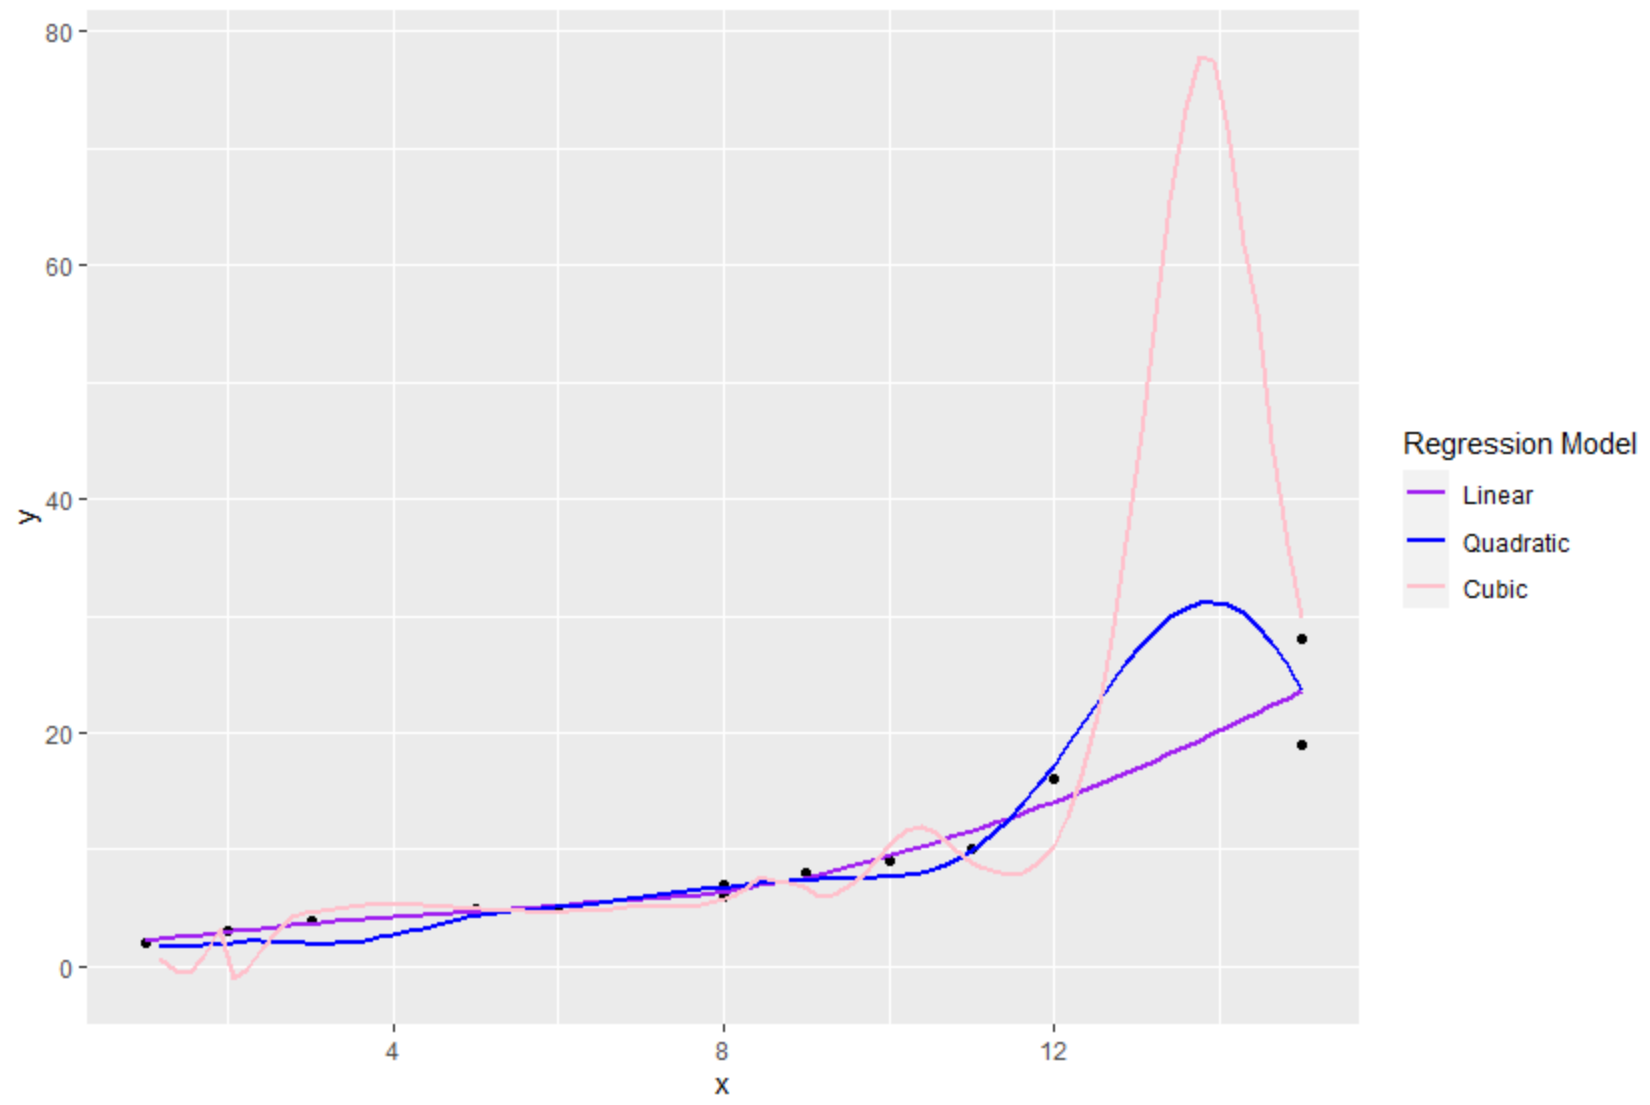
以下代码展示了如何使用自定义手动图例在 ggplot2 图中绘制三个拟合回归线:
 library (ggplot2)

#create data frame
df <- data. frame (x=c(1, 2, 2, 3, 5, 6, 8, 8, 9, 9, 10, 11, 12, 15, 15),
                 y=c(2, 3, 3, 4, 5, 5, 6, 7, 8, 8, 9, 10, 16, 19, 28))

#create plot with three fitted regression models
ggplot(df, aes(x, y)) +
  geom_point() +
  geom_smooth(se= FALSE , aes(color=' Linear ')) +
  geom_smooth(formula=y~poly(x, 2), se= FALSE , aes(color=' Quadratic ')) +
  geom_smooth(formula=y~poly(x, 3), se= FALSE , aes(color=' Cubic ')) +
  scale_color_manual(name=' Regression Model ',
                     breaks=c(' Linear ', ' Quadratic ', ' Cubic '),
                     values=c(' Cubic '=' pink ', ' Quadratic '=' blue ', ' Linear '=' purple '))

使用scale_color_manual()函数,我们能够指定图例的以下方面:
- name : 图例的标题
- Breaks : 图例中的标签
- value :图例中的颜色
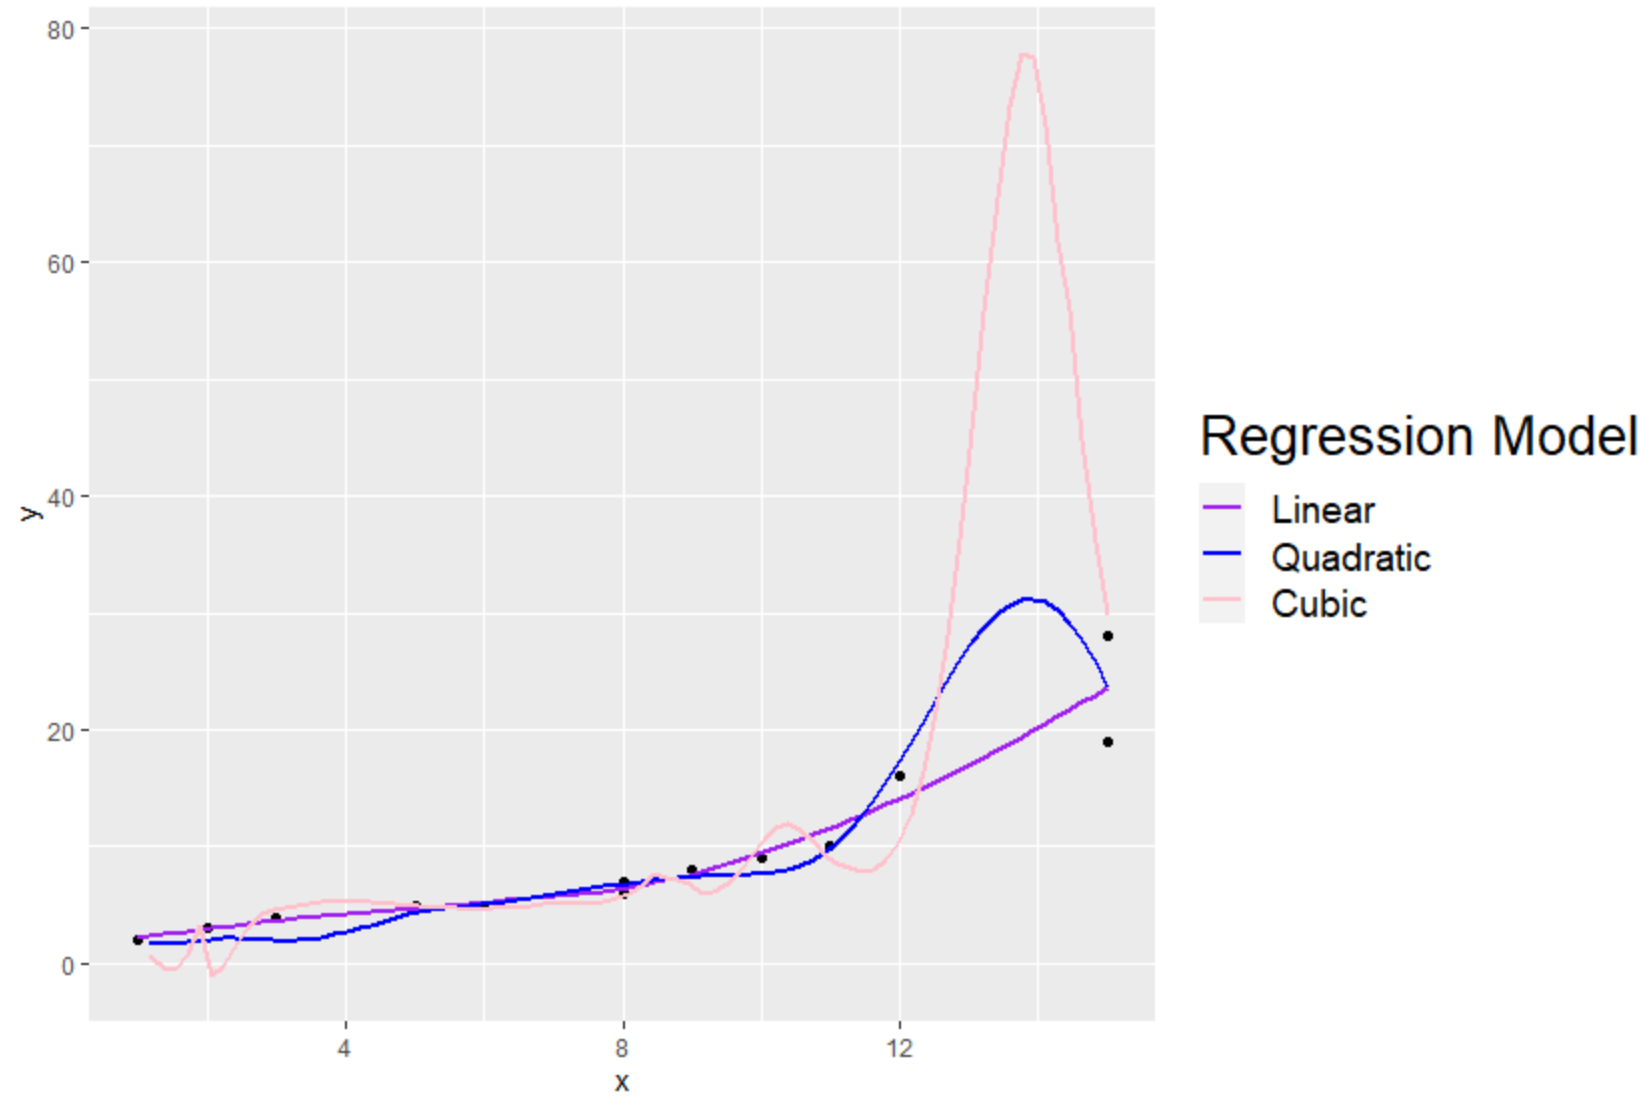
请注意,我们还可以使用theme()函数来更改图例元素的字体大小:
 library (ggplot2)

#create data frame
df <- data. frame (x=c(1, 2, 2, 3, 5, 6, 8, 8, 9, 9, 10, 11, 12, 15, 15),
                 y=c(2, 3, 3, 4, 5, 5, 6, 7, 8, 8, 9, 10, 16, 19, 28))

#create plot with three fitted regression models
ggplot(df, aes(x, y)) +
  geom_point() +
  geom_smooth(se= FALSE , aes(color=' Linear ')) +
  geom_smooth(formula=y~poly(x, 2), se= FALSE , aes(color=' Quadratic ')) +
  geom_smooth(formula=y~poly(x, 3), se= FALSE , aes(color=' Cubic ')) +
  scale_color_manual(name=' Regression Model ',
                     breaks=c(' Linear ', ' Quadratic ', ' Cubic '),
                     values=c(' Cubic '=' pink ', ' Quadratic '=' blue ', ' Linear '=' purple '))+
 theme(legend. title =element_text(size= 20 ),
       legend. text =element_text(size= 14 ))

请注意,标题和说明标签的字体大小已增加。
其他资源
以下教程解释了如何在ggplot2中执行其他常见操作:
如何更改ggplot2中的图例位置
如何更改ggplot2中的图例大小
如何更改ggplot2中的图例标题
如何更改ggplot2中的图例标签