如何在 ggplot2 中绘制箭头(附示例)
您可以使用以下基本语法在 ggplot2 的图中绘制箭头:
 library (ggplot2)

ggplot(df, aes(x=x, y=y)) +
  geom_point() +
  geom_segment(aes(x= 5 , y= 6 , xend= 8 , yend= 9 ), arrow = arrow(length=unit( 0.5 , ' cm ')))
以下是geom_segment()函数中每个参数的作用:
- x :开始的 x 值
- y :起始 y 值
- xend :结束的 x 值
- Yind :结束的 y 值
- arrow : 箭头尖端的长度
以下示例展示了如何在实践中使用 ggplot2 绘制箭头。
示例:在 ggplot2 中绘制箭头
假设我们有以下数据库,其中包含各个篮球运动员的得分和篮板数信息:
 #create data frame
df <- data. frame (points=c(3, 3, 5, 6, 7, 8, 9, 9, 8, 5),
                 rebounds=c(2, 6, 5, 5, 8, 5, 9, 9, 8, 6))

#view data frame
df

   rebound points
1 3 2
2 3 6
3 5 5
4 6 5
5 7 8
6 8 5
7 9 9
8 9 9
9 8 8
10 5 6
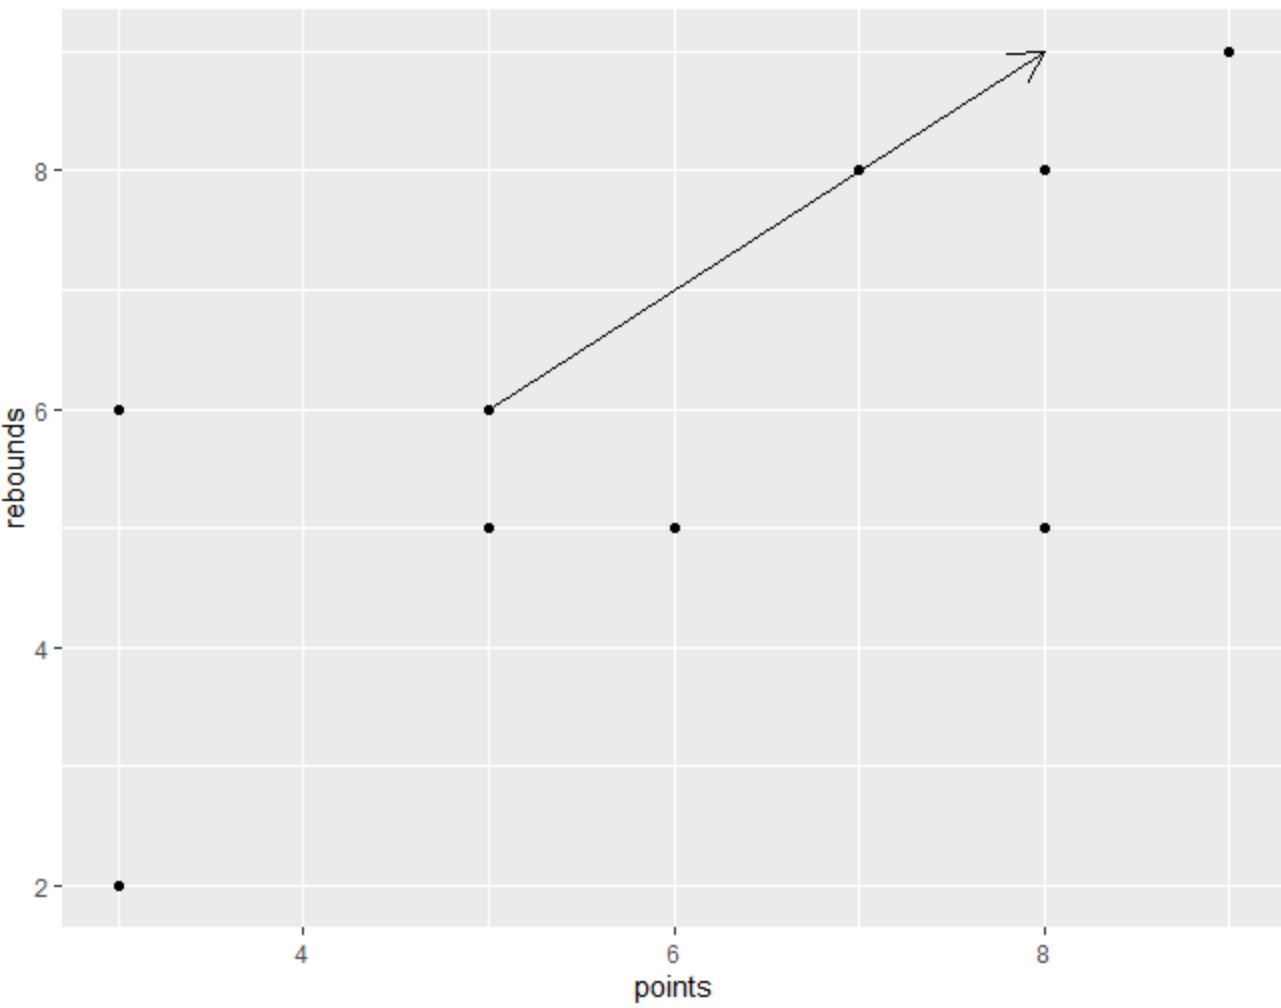
我们可以使用以下语法在 ggplot2 中创建散点图,并在绘图上的特定位置添加箭头:
 library (ggplot2)

#create scatterplot and add arrow
ggplot(df, aes(x=points, y=rebounds)) +
  geom_point() +
  geom_segment(aes(x= 5 , y= 6 , xend= 8 , yend= 9 ), arrow = arrow(length=unit( .5 , ' cm ')))

请随意更改arrow()函数中的值以增大或减小箭头的大小。
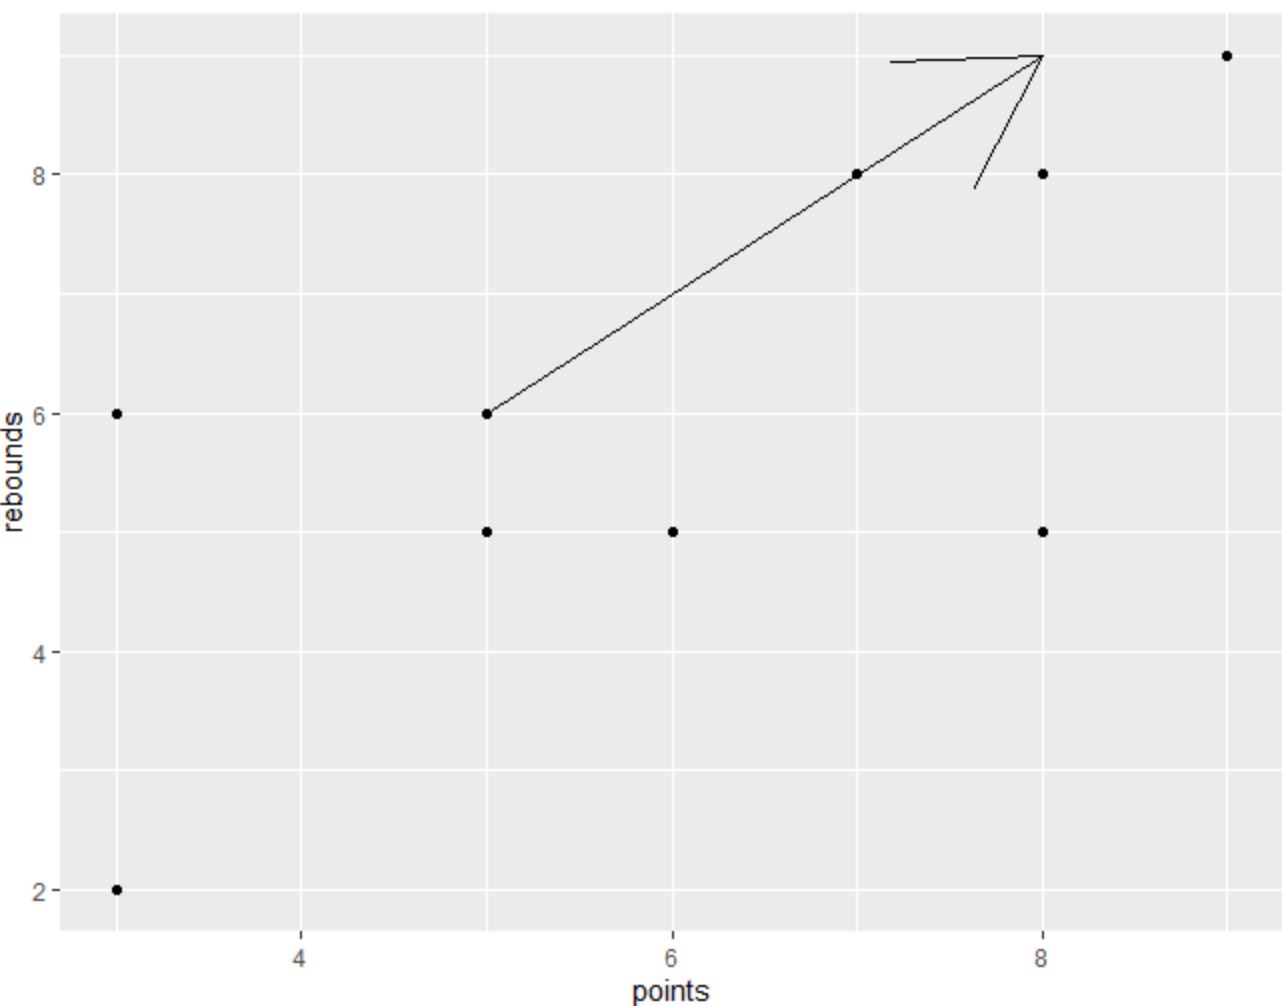
例如,以下代码显示了如何增加大小:
 library (ggplot2)

#create scatterplot and add arrow with increased arrow head size
ggplot(df, aes(x=points, y=rebounds)) +
  geom_point() +
  geom_segment(aes(x= 5 , y= 6 , xend= 8 , yend= 9 ), arrow = arrow(length=unit( 2 , ' cm ')))

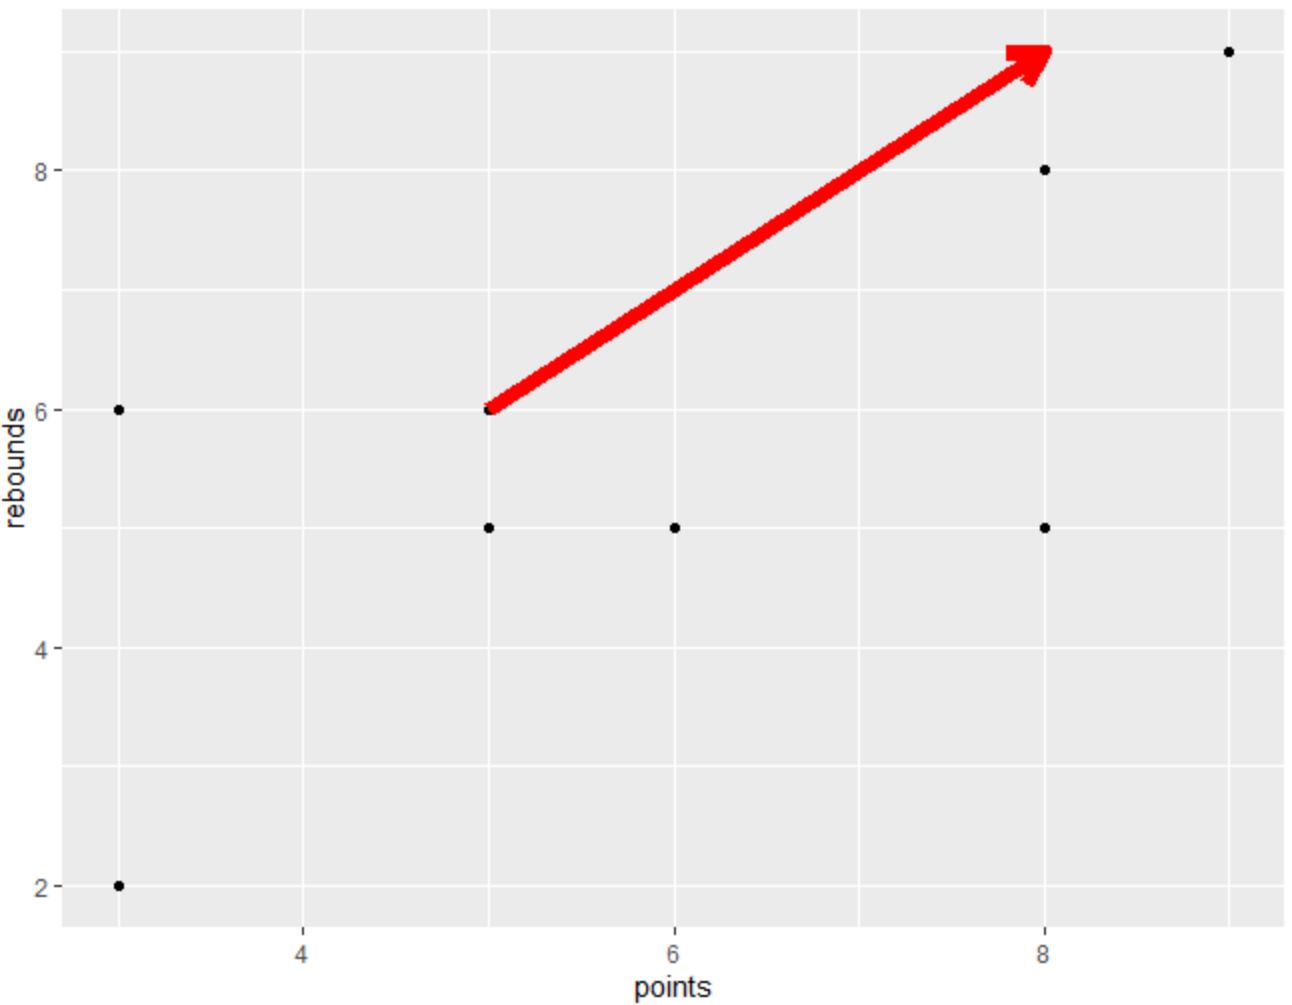
您还可以使用color和lwd参数分别更改箭头的颜色和线宽:
 library (ggplot2)

#create scatterplot and add customized arrow
ggplot(df, aes(x=points, y=rebounds)) +
  geom_point() +
  geom_segment(aes(x= 5 , y= 6 , xend= 8 , yend= 9 ), arrow = arrow(length=unit( .5 , ' cm ')),
               color=' red ', lwd= 3 )

请随意使用geom_segment()函数的不同参数来创建看起来与您想要的完全一样的箭头。
其他资源
以下教程解释了如何在 ggplot2 中执行其他常见任务:
如何删除ggplot2中的网格线
如何在ggplot2中对区域进行着色
如何更改ggplot2中的X轴标签