Ggplot2中如何调整线条粗细
您可以使用size参数来调整ggplot2中线条的粗细:
 ggplot(df, aes (x = x, y = y)) +
  geom_line(size = 1.5 )
大小默认为 1,但您可以指定要调整其厚度的任何小数值。
本教程提供了如何在实践中调整线宽的示例。
示例:调整 ggplot2 中的线条粗细
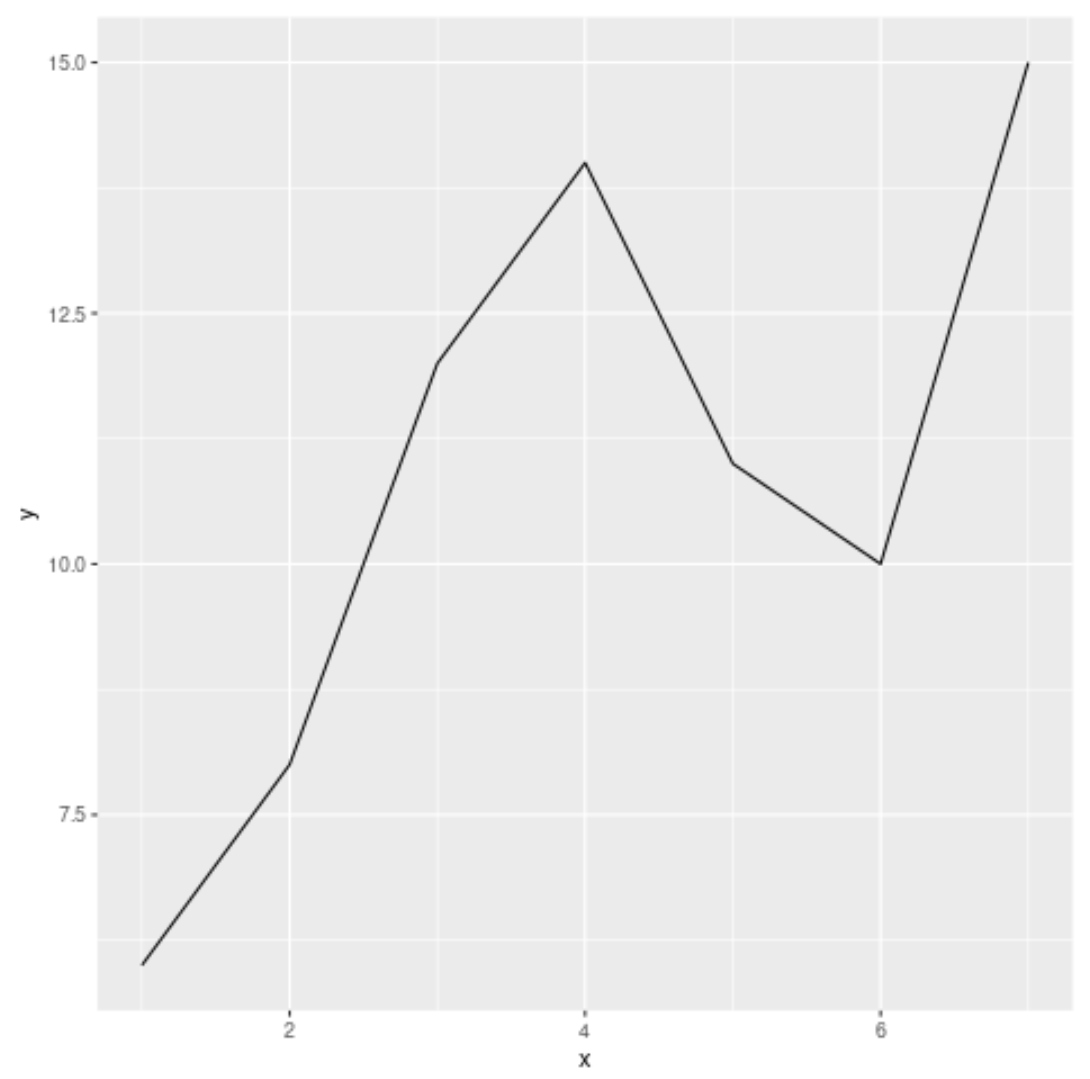
以下代码展示了如何使用 ggplot2 创建简单的线图:
 #load ggplot2 visualization package
library (ggplot2)

#create data
df <- data. frame (x=c(1, 2, 3, 4, 5, 6, 7),
                 y=c(6, 8, 12, 14, 11, 10, 15))

#create line plot
ggplot(df, aes (x = x, y = y)) +
  geom_line()
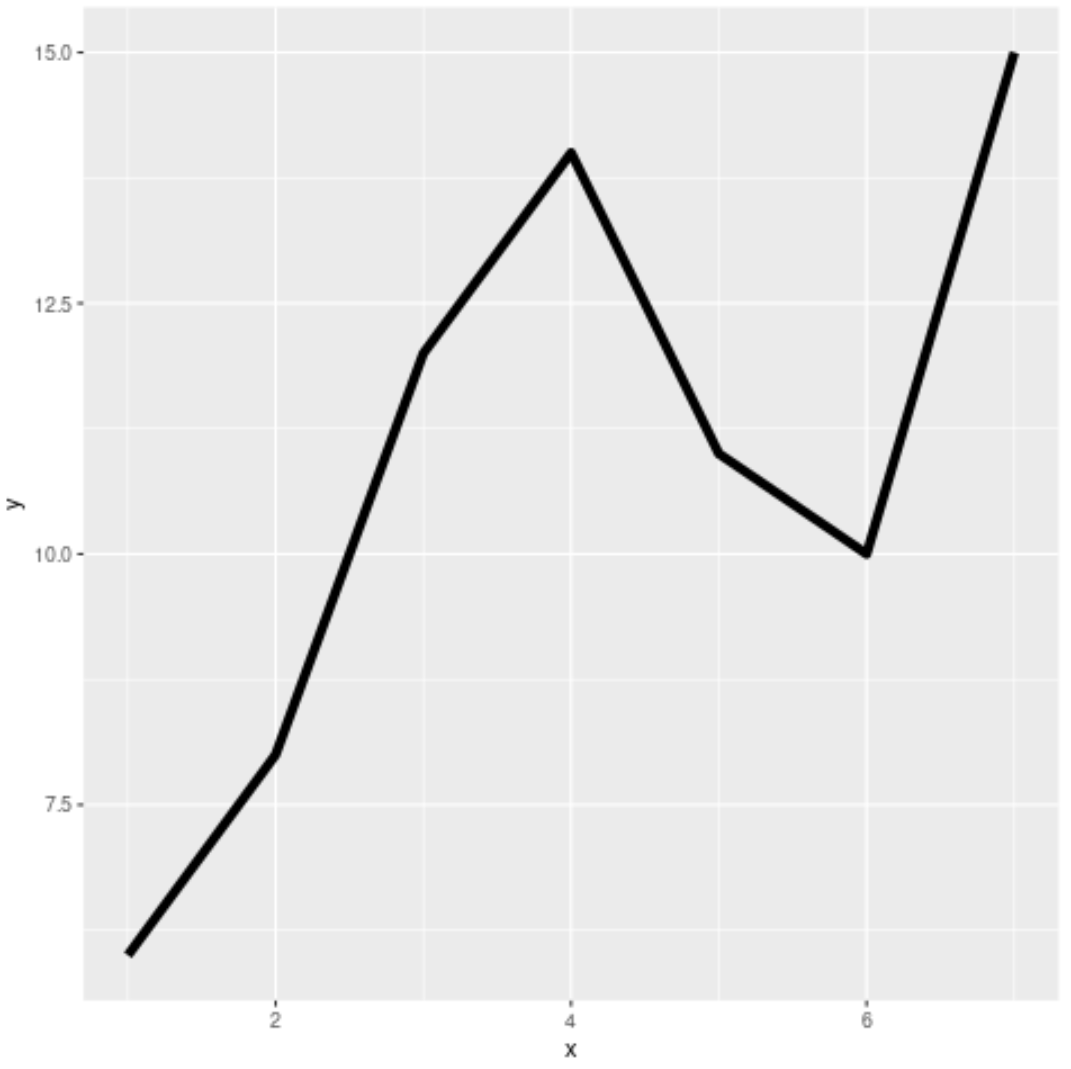
默认情况下,线条粗细等于 1,但可以使用size参数来增加:
 library (ggplot2)

#create line plot
ggplot(df, aes (x = x, y = y)) +
  geom_line(size = 2 )
以下代码使用不同的线宽大小显示不同的线图:
 library (ggplot2)
library (gridExtra)

#create data
df <- data. frame (x=c(1, 2, 3, 4, 5, 6, 7),
                 y=c(6, 8, 12, 14, 11, 10, 15))

#create four line plots
plot1 <- ggplot(df, aes (x=x,y=y)) + geom_line() + ggtitle(" Size = 1 (Default) ")
plot2 <- ggplot(df, aes (x=x,y=y)) + geom_line(size= 1.5 ) + ggtitle(" Size = 1.5 ")
plot3 <- ggplot(df, aes (x=x,y=y)) + geom_line(size= 2 ) + ggtitle(" Size = 2 ")
plot4 <- ggplot(df, aes (x=x,y=y)) + geom_line(size= 3 ) + ggtitle(" Size = 3 ")

#display all line plots stacked on top of each other
grid. arrange (plot1, plot2, plot3, plot4, ncol=1)
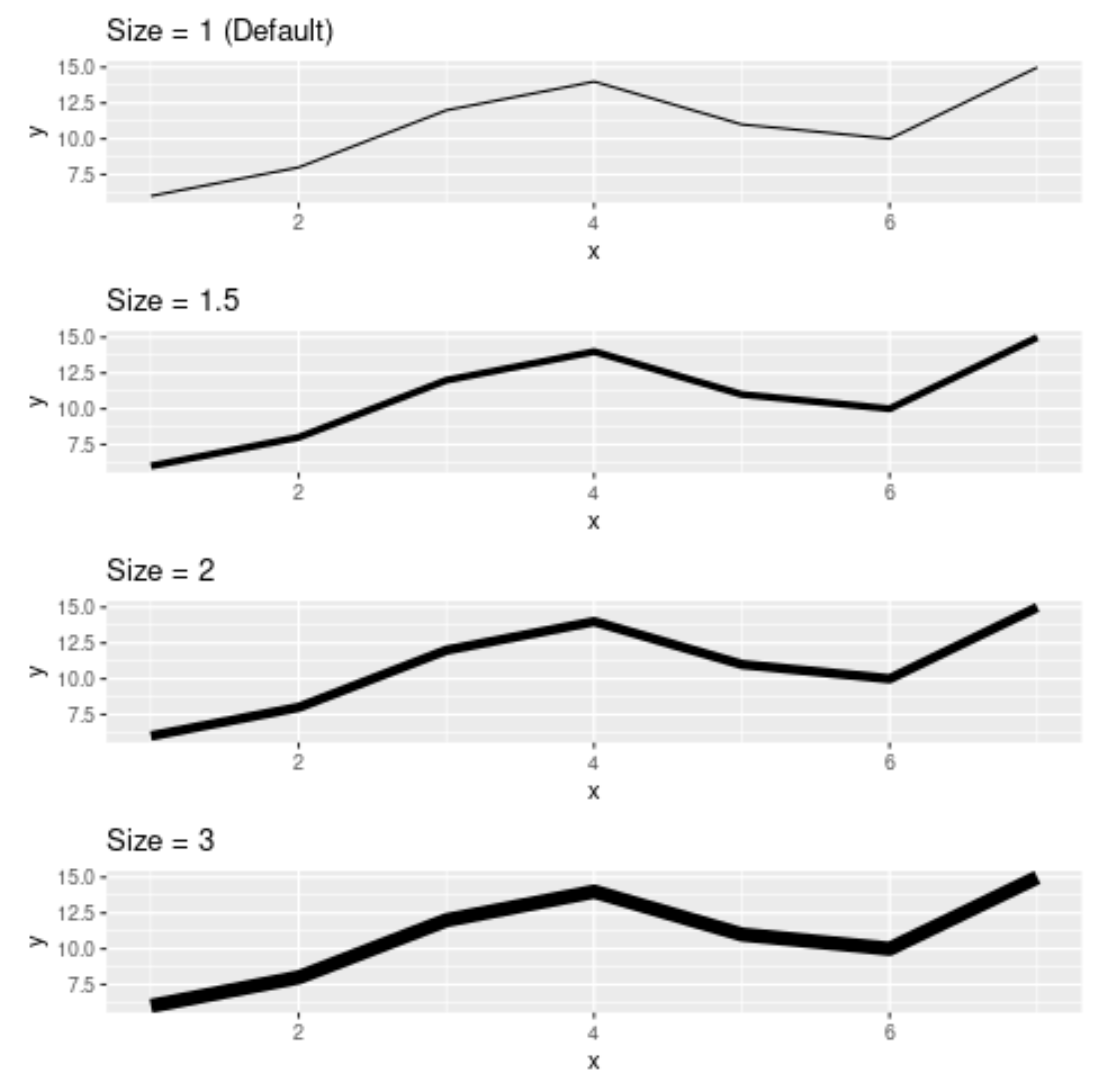
为尺寸参数指定的值越大,图中的线条就越粗。
在此处查找更多 R 教程。
关于作者
本杰明·安德森博
大家好,我是本杰明,一位退休的统计学教授,后来成为 Statorials 的热心教师。 凭借在统计领域的丰富经验和专业知识,我渴望分享我的知识,通过 Statorials 增强学生的能力。了解更多