如何更改 ggplot2 中的轴刻度计数(带有示例)
您可以使用以下基本语法来更改 ggplot2 绘图上的轴刻度数:
 p+
  scale_x_continuous(n. breaks = 10 ) +
  scale_y_continuous(n. breaks = 10 )
以下示例展示了如何在实践中使用此语法。
示例:更改 ggplot2 中的轴刻度数
假设我们在 R 中有以下数据框:
 #create data frame
df <- data. frame (x=c(1, 2, 4, 5, 6, 8, 12, 14, 19),
                 y=c(2, 5, 7, 8, 14, 19, 22, 28, 36))

#view data frame
df

   xy
1 1 2
2 2 5
3 4 7
4 5 8
5 6 14
6 8 19
7 12 22
8 14 28
9 19 36
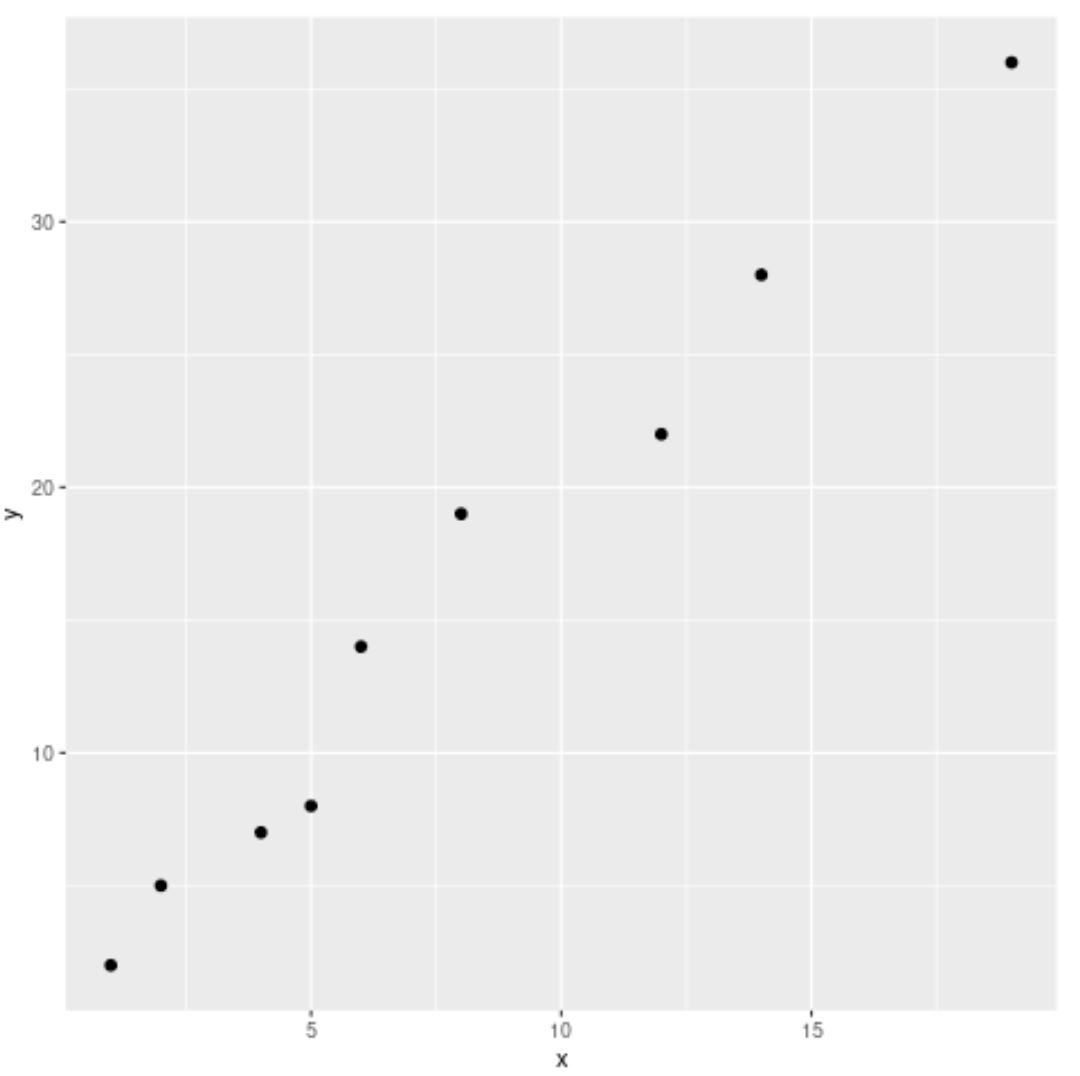
如果我们创建散点图,ggplot2 将自动为 x 轴和 y 轴选择适当的刻度数:
 library (ggplot2)

#create scatterplot
ggplot(df, aes(x=x, y=y)) +
  geom_point(size= 2 )

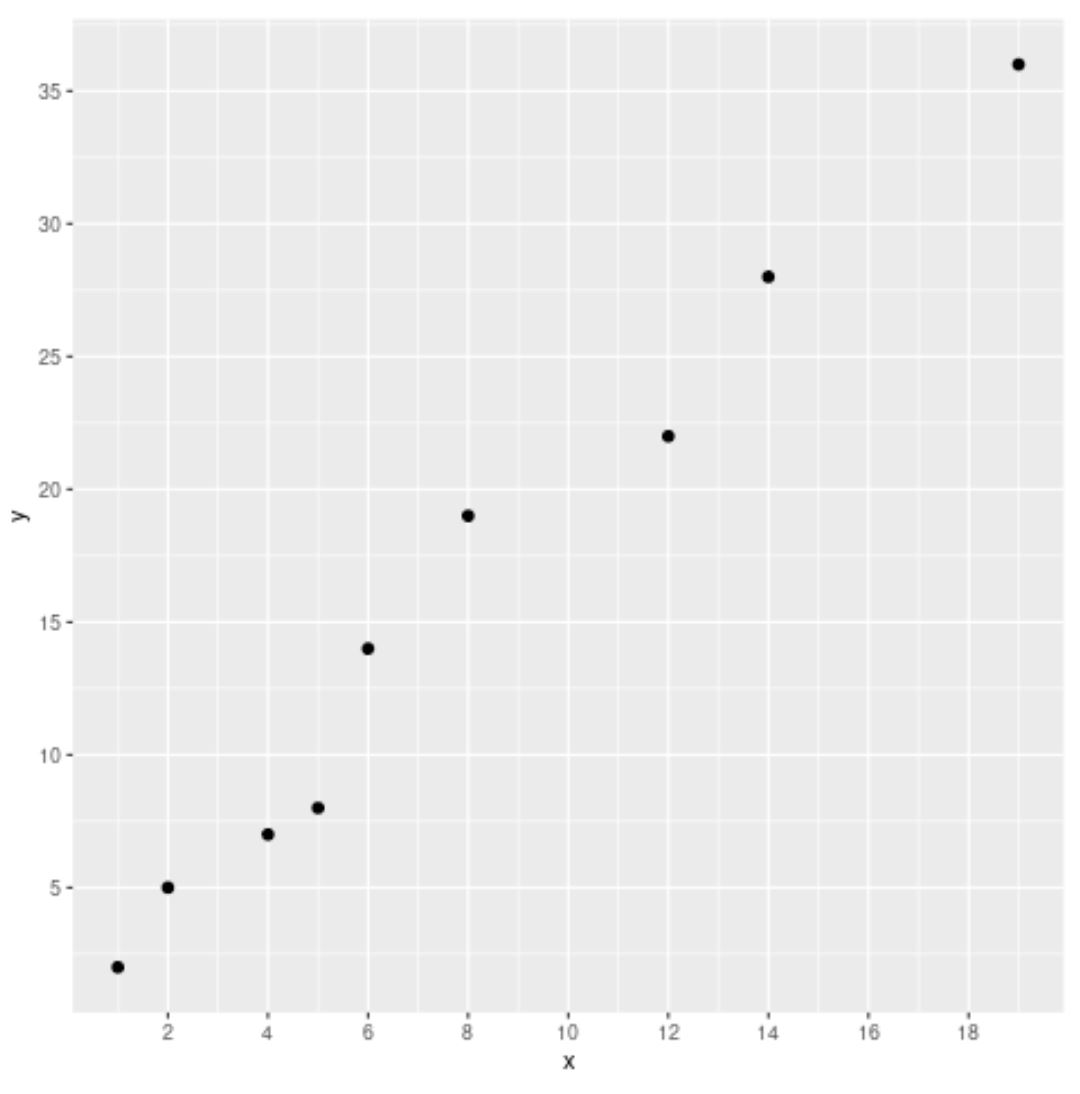
但是,我们可以使用n.breaks参数来指定在两个轴上使用的确切刻度数:
 library (ggplot2)

#create scatter plot with custom number of ticks
ggplot(df, aes(x=x, y=y)) +
  geom_point(size= 2 ) +
  scale_x_continuous(n. breaks = 10 ) +
  scale_y_continuous(n. breaks = 10 )

请注意,两个轴上的刻度数都增加了。
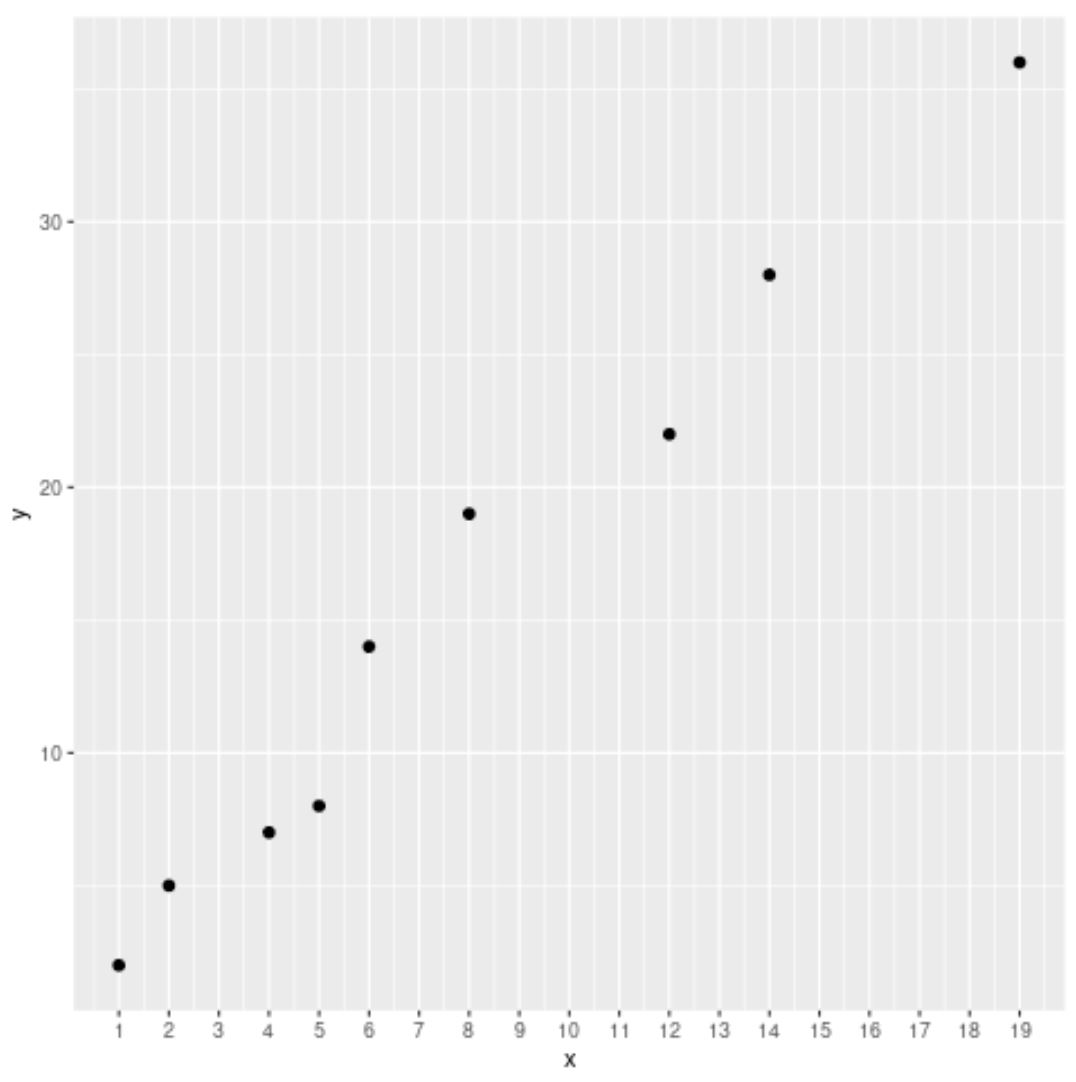
另请注意,如果您愿意,可以更改单个轴上的刻度数:
 library (ggplot2)

#create scatter plot with custom number of ticks on x-axis only
ggplot(df, aes(x=x, y=y)) +
  geom_point(size= 2 ) +
  scale_x_continuous(n. breaks = 20 )

在此示例中,ggplot2 选择 y 轴上使用的刻度数,但 x 轴上的刻度数由n.breaks参数中的数字确定。
其他资源
以下教程解释了如何在 ggplot2 中执行其他常见任务:
如何在ggplot2中旋转轴标签
如何在ggplot2中设置轴中断
如何在ggplot2中设置轴限制
如何更改ggplot2中的图例标签