如何更改 ggplot2 中的边距(带有示例)
您可以使用 ggplot2 中的theme()参数来修改绘图的边距区域:
 ggplot(df, aes(x=x)) +
  geom_histogram() +
  theme(plot. margin =unit(c(5,1,1,1), ' cm '))
请记住,绘图边距的顺序如下:
- 单位(c(上,右,下,左),单位)
以下示例展示了如何在实践中更改 ggplot2 图的边缘区域。
示例 1:创建基本图
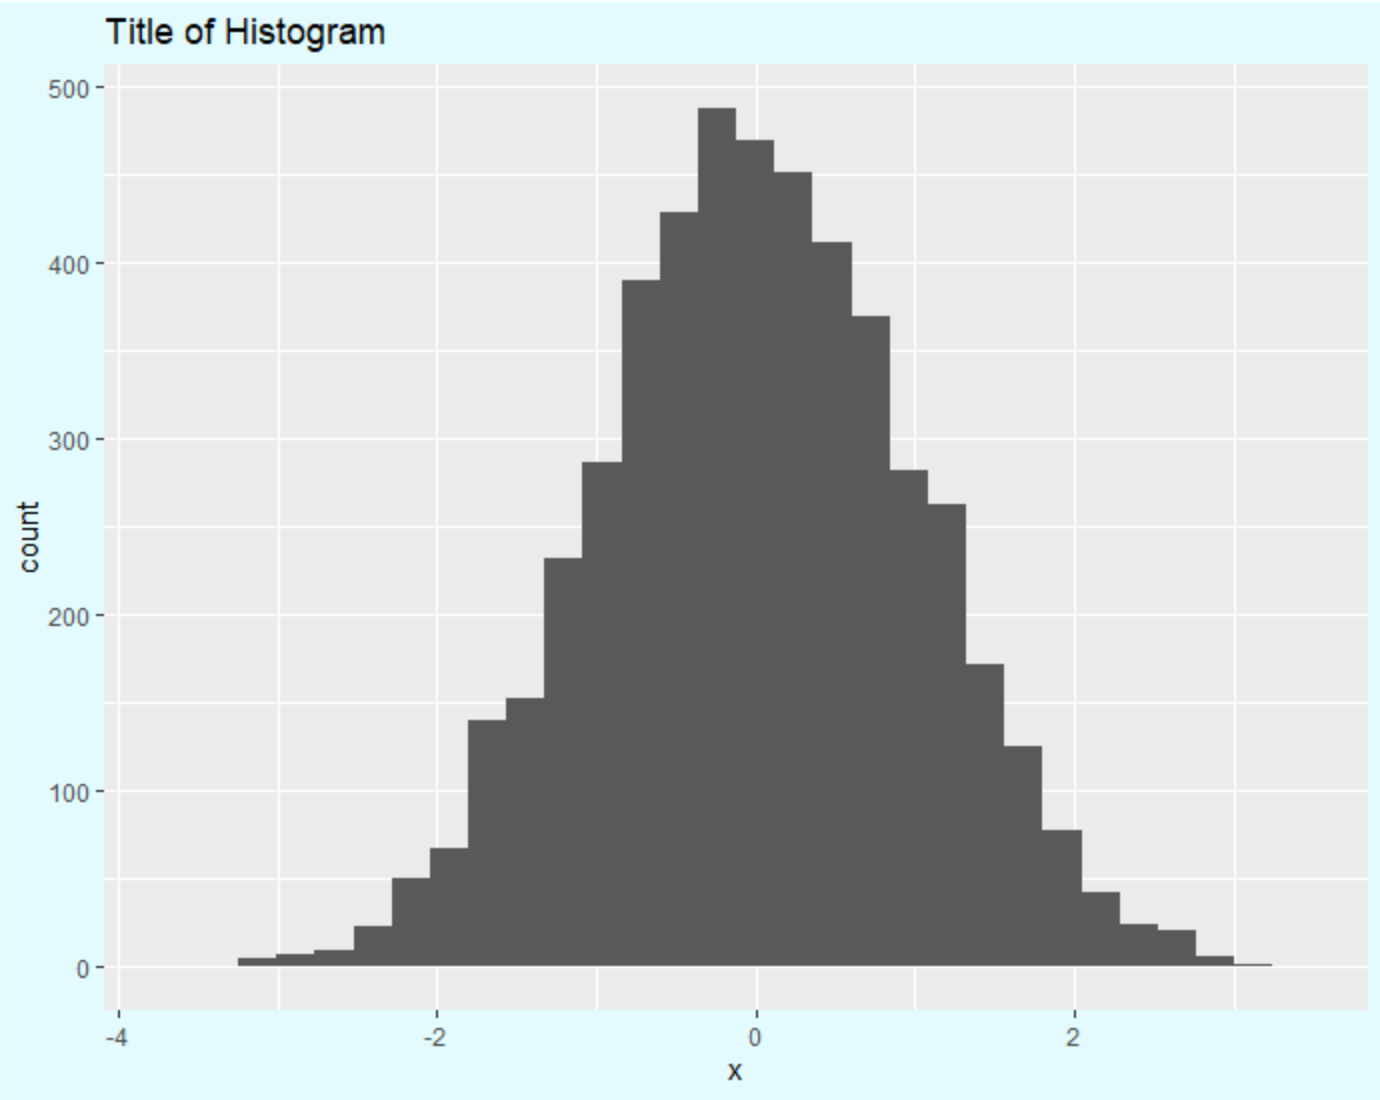
以下代码展示了如何在 ggplot2 中创建基本绘图而不指定边距区域:
 library (ggplot2)

#make this example reproducible
set. seeds (0)

#create data
df <- data. frame (x=rnorm(n= 5000 ))

#create histogram using ggplot2
ggplot(df, aes(x=x)) +
  geom_histogram() +
  ggtitle(' Title of Histogram ') +
  theme(plot. background =element_rect(fill=' #e3fbff '))

请注意,该图每边的边距最小。
示例 2:更改绘图边距
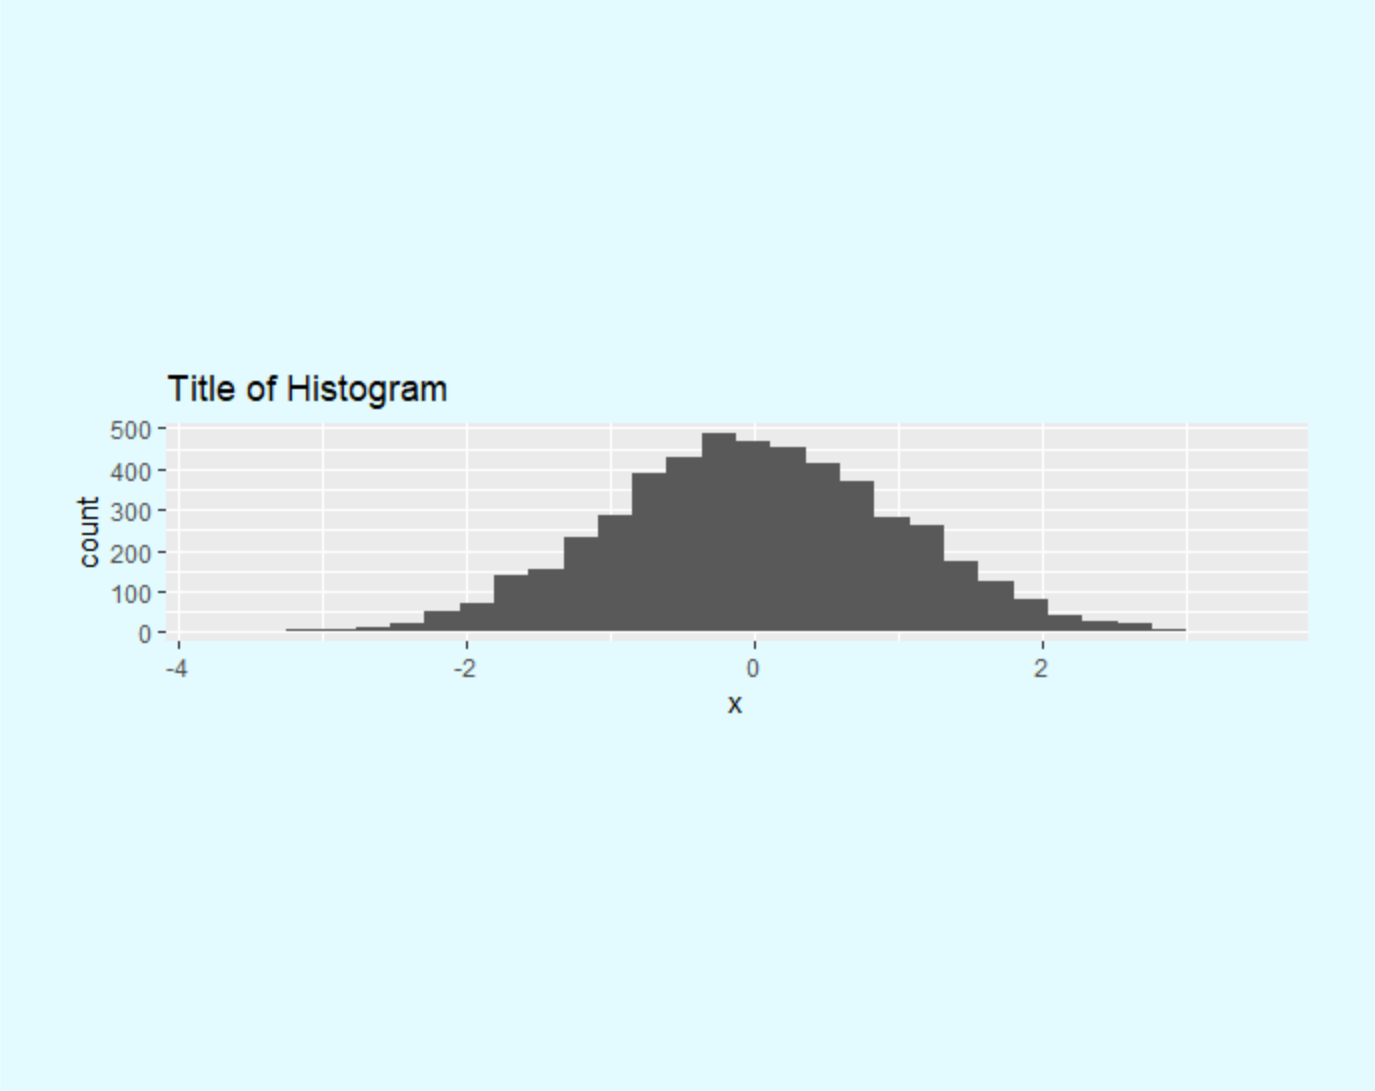
以下代码显示了如何在图的顶部和底部添加显着的边距:
 library (ggplot2)

#make this example reproducible
set. seeds (0)

#create data
df <- data. frame (x=rnorm(n= 5000 ))

#create histogram with significant margins on top and bottom
ggplot(df, aes(x=x)) +
  geom_histogram() +
  ggtitle(' Title of Histogram ') +
  theme(plot. margin =unit(c(5,1,5,1), ' cm '),
        plot. background =element_rect(fill=' #e3fbff '))

请注意,绘图的顶部和底部有大量空间。
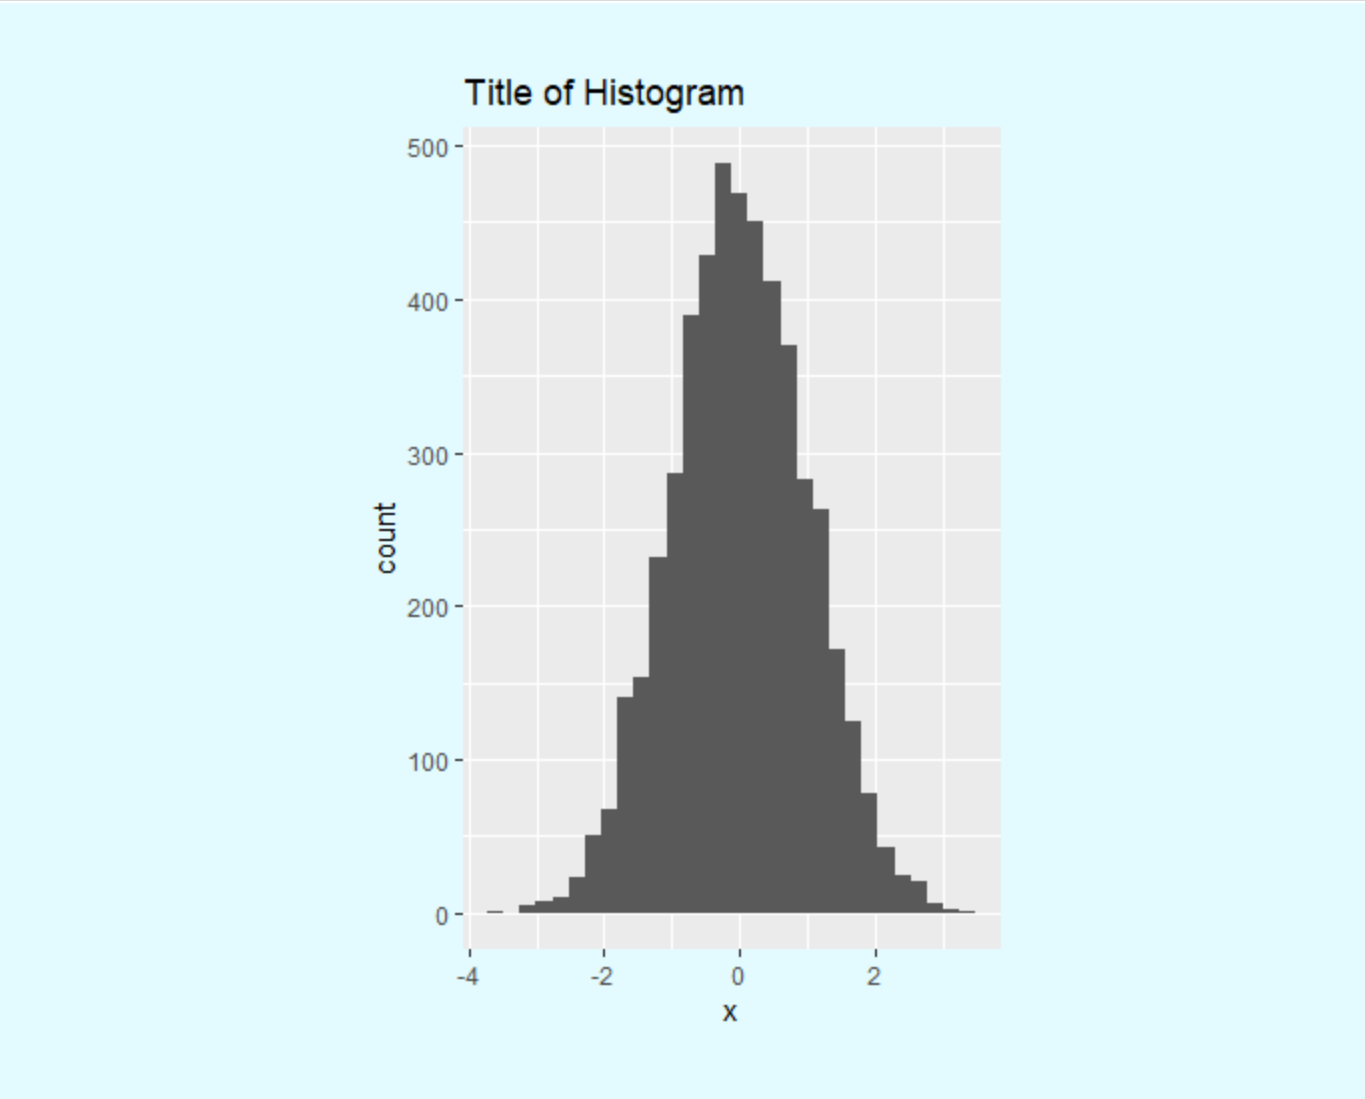
下面的代码展示了如何在绘图的左侧和右侧添加显着的边距:
 library (ggplot2)

#make this example reproducible
set. seeds (0)

#create data
df <- data. frame (x=rnorm(n= 5000 ))

#create histogram with significant margins on left and right
ggplot(df, aes(x=x)) +
  geom_histogram() +
  ggtitle(' Title of Histogram ') +
  theme(plot. margin =unit(c(1,5,1,5), ' cm '),
        plot. background =element_rect(fill=' #e3fbff '))

请注意,绘图的左侧和右侧有很多空间。
其他资源
以下教程解释了如何在ggplot2中执行其他常见操作:
如何更改ggplot2中的字体大小
如何在ggplot2中旋转轴标签
如何删除ggplot2中的图例
如何删除ggplot2中的轴标签