如何修复错误:“数据”必须是数据框或可通过“fortify()”强制转换的其他对象,而不是数字向量
在 R 中您可能遇到的错误是:
 Error: `data` must be a data frame, or other object coercible by `fortify()`,
        not a digital vector
当您尝试使用ggplot2在数据框中绘制变量,但为数据参数引用向量而不是数据框时,会出现此错误。
本教程准确解释了如何修复此错误。
如何重现错误
假设我们在 R 中有以下数据框:
 #create data frame
df <- data. frame (x=c(1, 2, 3, 4, 5, 6, 7, 8),
                 y=c(4, 8, 14, 19, 14, 13, 9, 9))

#view data frame
df

  xy
1 1 4
2 2 8
3 3 14
4 4 19
5 5 14
6 6 13
7 7 9
8 8 9
现在假设我们尝试创建一个散点图来可视化数据框中的 x 和 y 变量:
 library (ggplot2)

#attempt to create scatter plot
ggplot(df$x, aes(x=x, y=y)) +
    geom_point()

Error: `data` must be a data frame, or other object coercible by `fortify()`,
        not a digital vector
我们收到错误,因为我们在ggplot()函数的数据参数中引用了数字向量 ( df$x ),而不是数据框。
如何修复错误
修复此错误的方法是在ggplot()函数中引用数据参数的数据框。
在我们的示例中,我们应该使用df而不是df$x作为数据参数:
 library (ggplot2)

#create scatterplot
ggplot(df, aes(x=x, y=y)) +
    geom_point()
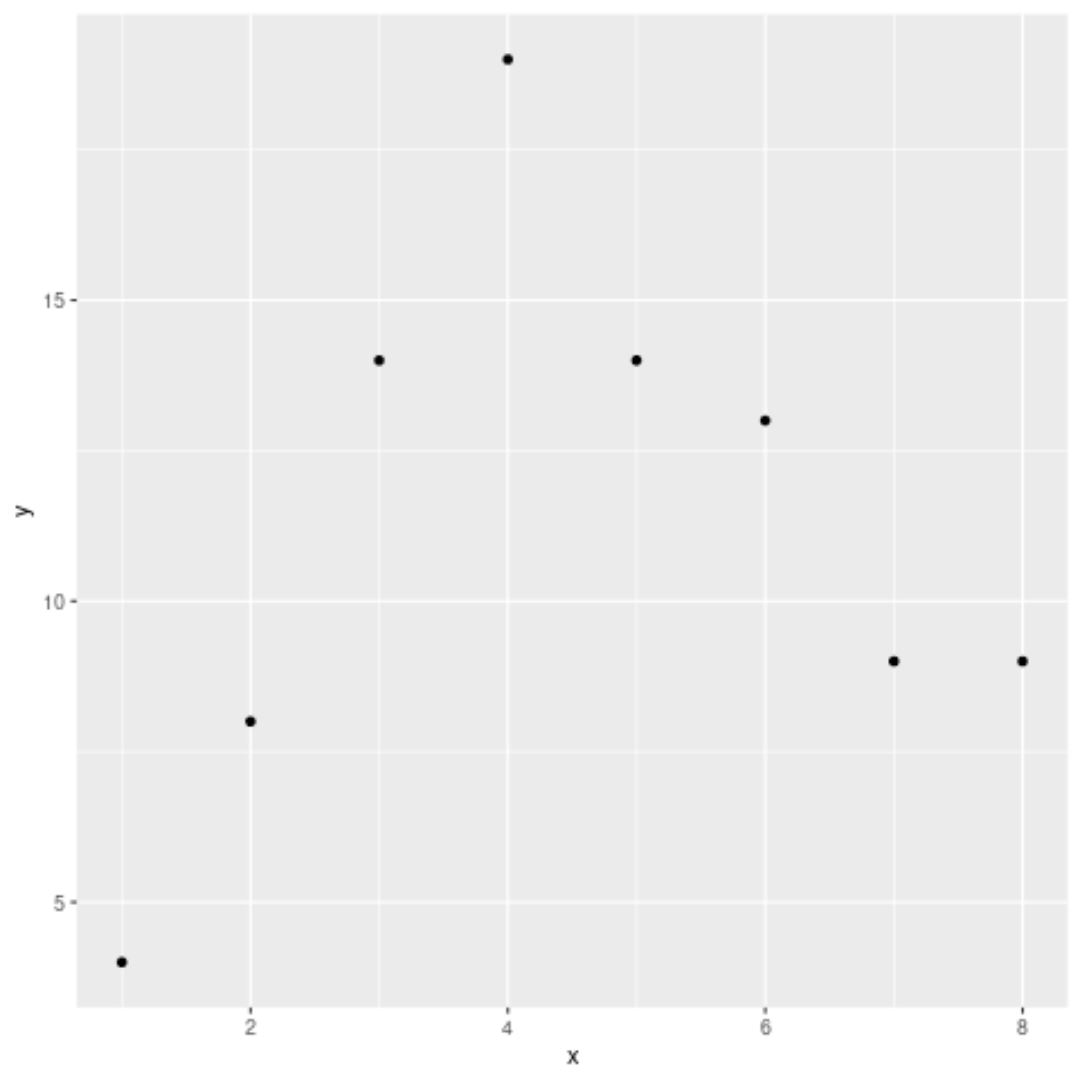
请注意,这次我们能够成功创建点云,没有任何错误。
其他资源
以下教程解释了如何解决 R 中的其他常见错误:
如何修复:ggplot2 不知道如何处理不相等的类数据
如何修复:stripchart.default(x1, …) 中的错误:无效的绘图方法
如何修复:eval 中的错误(predvars、data、env):未找到对象“x”
关于作者
本杰明·安德森博
大家好,我是本杰明,一位退休的统计学教授,后来成为 Statorials 的热心教师。 凭借在统计领域的丰富经验和专业知识,我渴望分享我的知识,通过 Statorials 增强学生的能力。了解更多