如何在ggplot2中使用scale_x_continuous(带有示例)
您可以使用 ggplot2 中的scale_x_continuous()函数来自定义给定图的x 轴。
该函数使用以下基本语法:
 p+
scale_x_continuous(breaks, n.breaks, labels, limits, ...)
金子:
- Breaks :x 轴上中断位置的数值向量
- n.breaks :一个整数向量,指定 x 轴上的总中断数
- labels :用于 x 轴的标签字符向量
- limit :一个数值向量,指定 x 轴的最小值和最大值
以下示例展示了如何在不同场景中使用此函数,并使用 R 中的以下数据帧:
 #create data frame
df <- data. frame (points=c(5, 7, 12, 13, 15, 19, 22, 25),
                 assists=c(4, 3, 2, 3, 7, 8, 5, 7))

#view data frame
df

  assist points
1 5 4
2 7 3
3 12 2
4 13 3
5 15 7
6 19 8
7 22 5
8 25 7
示例 1:使用带有自定义轴中断的scale_x_continuous
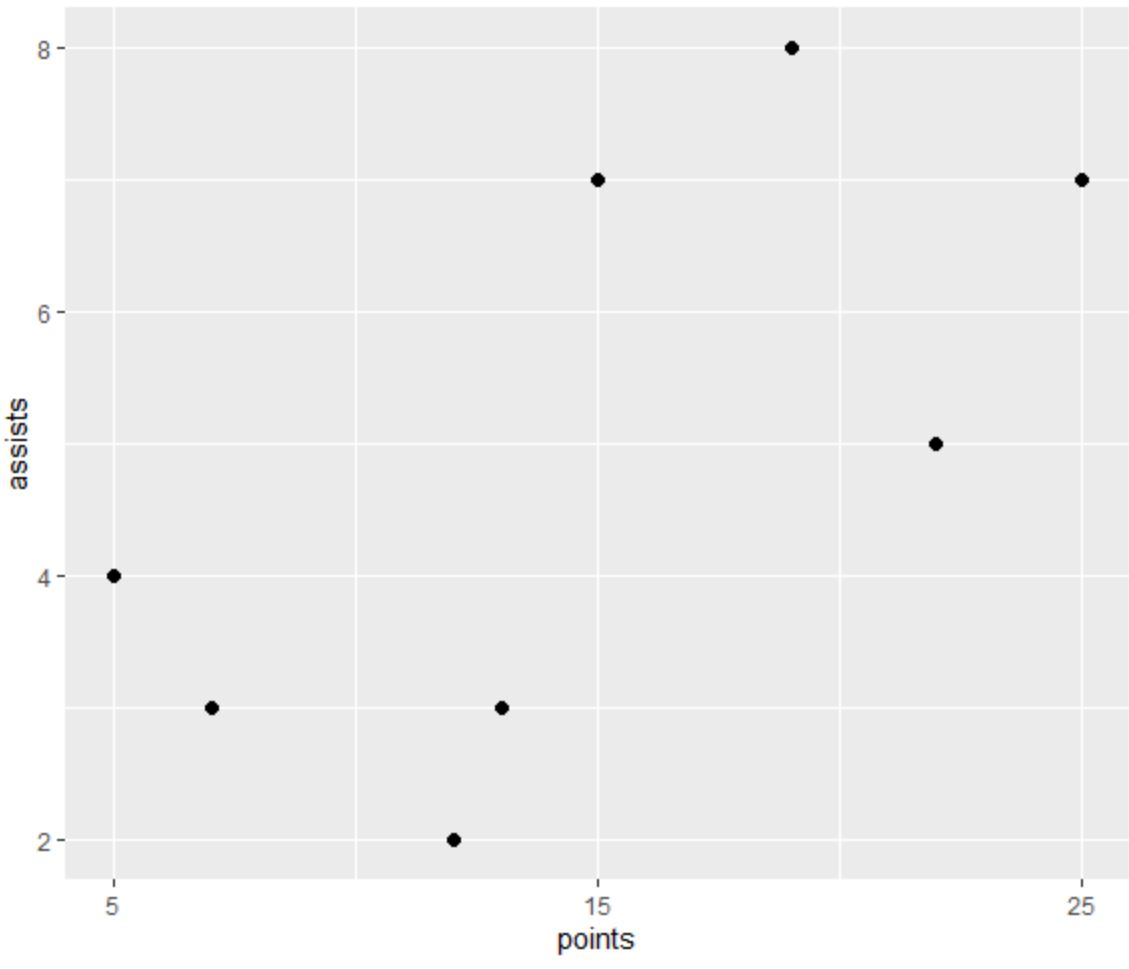
以下代码演示了如何在 ggplot2 中创建散点图,并使用带有Breaks参数的scale_x_continuous()来指定自定义轴间隔 5、15 和 25:
 library (ggplot2)

#create scatterplot with custom x-axis breaks
ggplot(df, aes(x=points, y=assists)) +
  geom_point(size= 2 ) +
  scale_x_continuous(breaks=c(5, 15, 25))

请注意,x 轴仅包含 5、15 和 25 处的轴中断,正如我们使用Breaks参数指定的那样。
示例 2:使用具有自定义暂停次数的scale_x_continuous
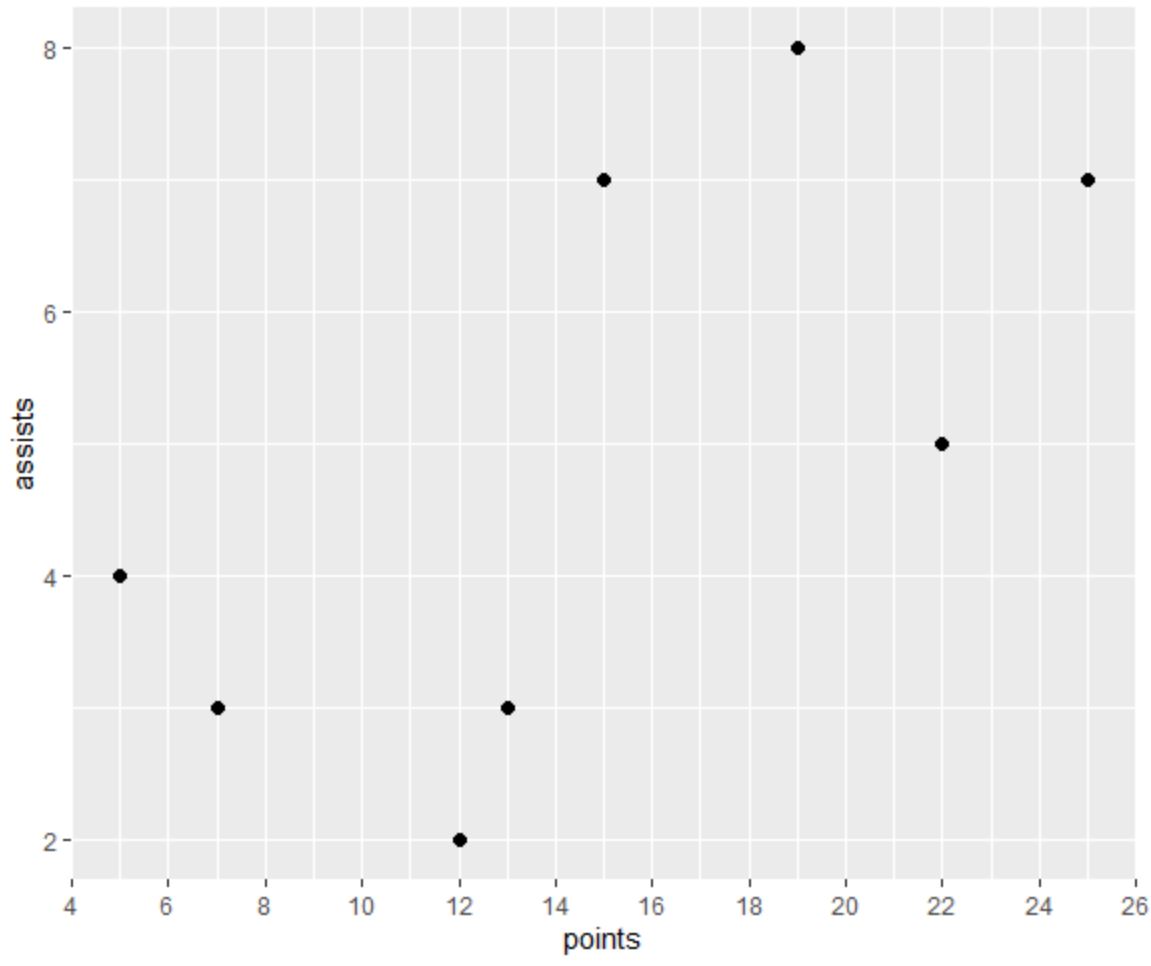
以下代码演示了如何在 ggplot2 中创建散点图,并使用带有n.breaks参数的scale_x_continuous()在 x 轴上精确放置 12 个轴中断:
 library (ggplot2)

#create scatterplot with custom number of breaks on x-axis
ggplot(df, aes(x=points, y=assists)) +
  geom_point(size= 2 ) +
  scale_x_continuous(n. breaks = 12 )

请注意,x 轴恰好包含 12 个轴中断,正如我们使用n.breaks参数指定的那样。
示例 3:将scale_x_continuous 与自定义标签一起使用
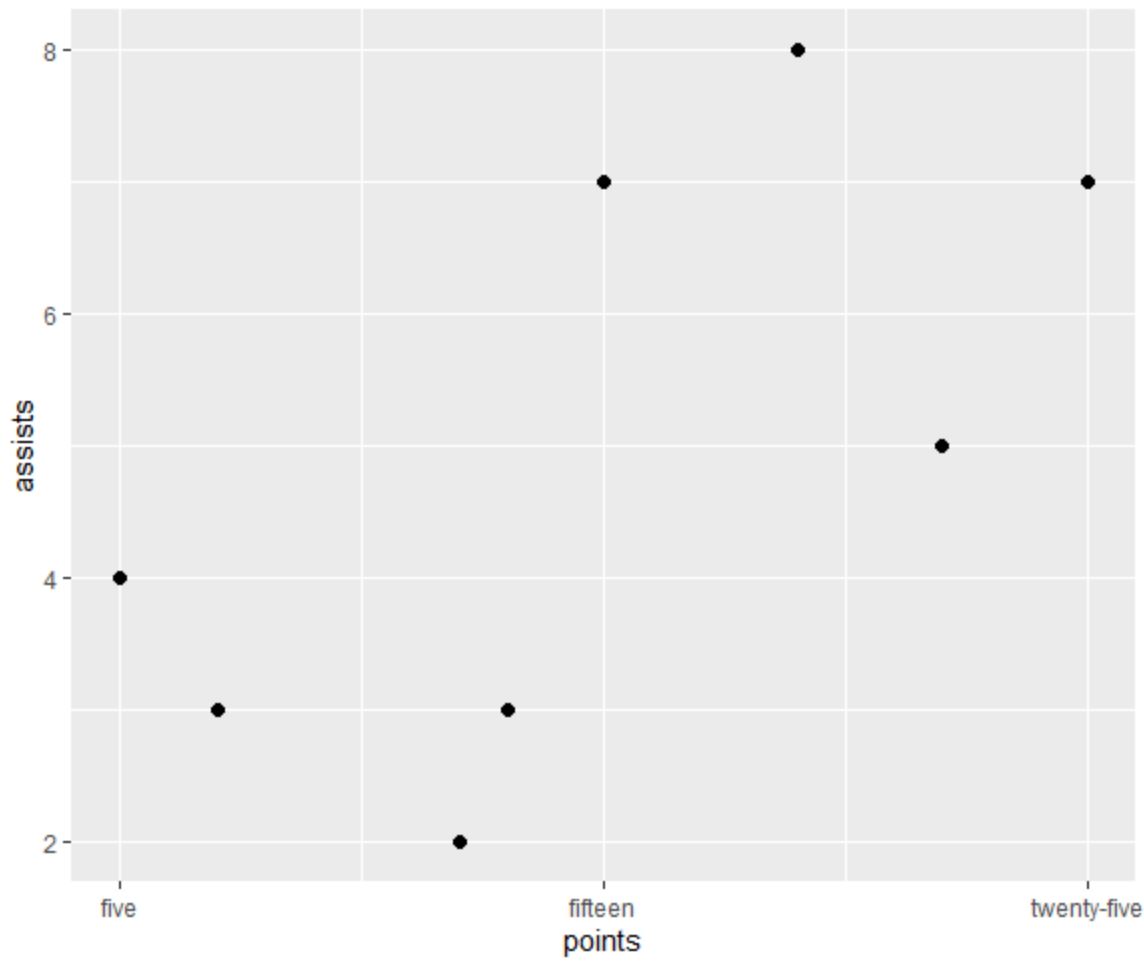
以下代码演示了如何在 ggplot2 中创建散点图,并使用带有labels参数的scale_x_continuous()来指定要放置在 x 轴上的标签名称:
 library (ggplot2)

#create scatterplot with custom labels on x-axis
ggplot(df, aes(x=points, y=assists)) +
  geom_point(size= 2 ) +
  scale_x_continuous(breaks=c(5, 15, 25), labels=c(' five ', ' fifteen ', ' twenty-five '))

请注意,x 轴包含 3 个轴断点,每个断点都有自定义标签,正如我们使用labels参数指定的那样。
示例 4:使用具有自定义限制的scale_x_continuous
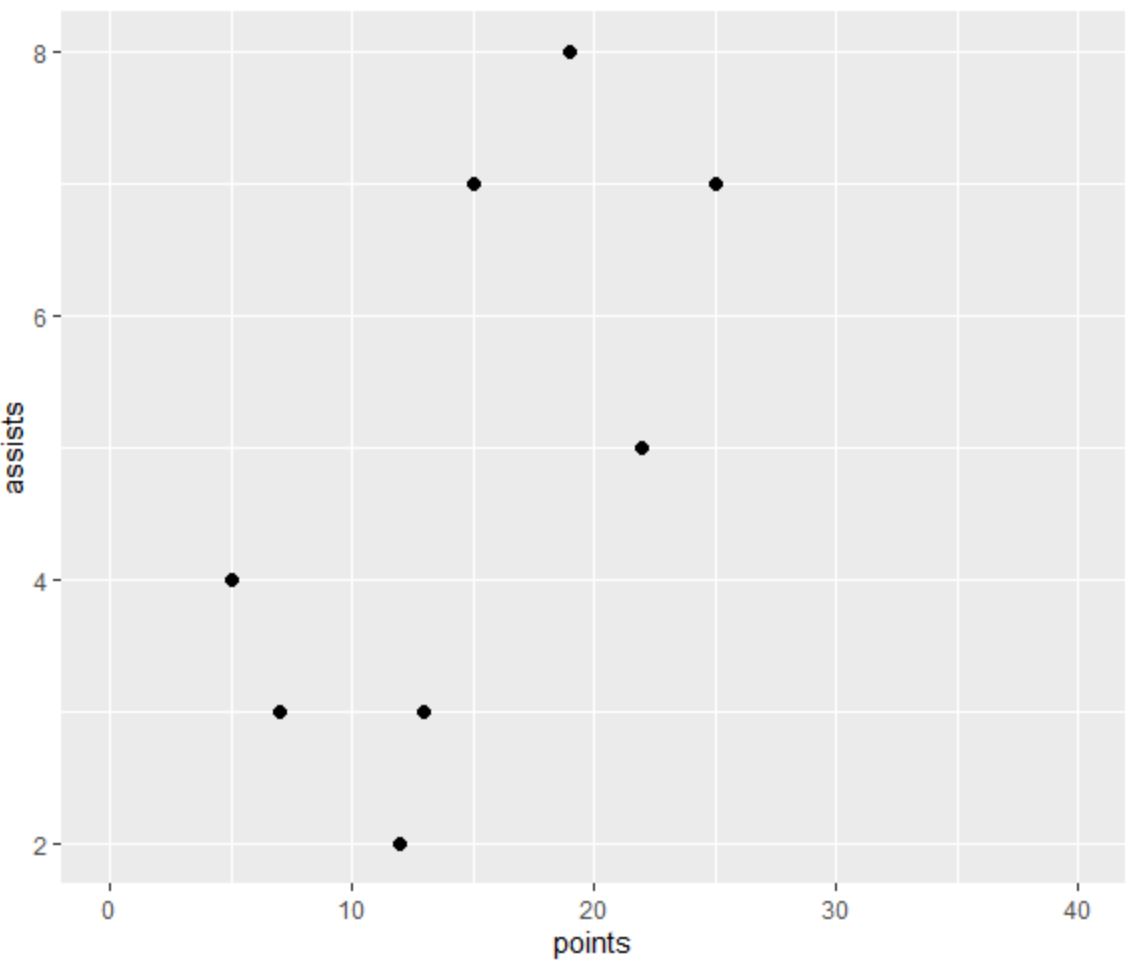
以下代码演示了如何在 ggplot2 中创建散点图,并使用带有limit参数的scale_x_continuous()来指定 x 轴上的自定义限制 0 和 40:
 library (ggplot2)

#create scatterplot with custom x-axis limits
ggplot(df, aes(x=points, y=assists)) +
  geom_point(size= 2 ) +
  scale_x_continuous(limits=c( 0 , 40 ))

请注意,x 轴从 0 到 40,正如我们使用limit参数指定的那样。
其他资源
以下教程解释了如何在 ggplot2 中执行其他常见任务: