如何更改 ggplot2 中的线条颜色(附示例)
您可以使用以下基本语法在 ggplot2 中指定线条颜色:
 ggplot(df, aes(x=x, y=y, group=group_var, color=group_var)) +
    geom_line() +
    scale_color_manual(values=c(' color1 ', ' color2 ', ' color3 '))
以下示例展示了如何在实践中使用此语法。
示例:更改 ggplot2 中的线条颜色
假设我们在 R 中有以下数据框:
 #create data frame
df <- data. frame (store=c('A', 'A', 'A', 'B', 'B', 'B', 'C', 'C', 'C'),
                 week=c(1, 2, 3, 1, 2, 3, 1, 2, 3),
                 sales=c(9, 12, 15, 7, 9, 14, 10, 16, 19))

#view data frame
df

  store week sales
1 To 1 9
2 to 2 12
3 to 3 15
4 B 1 7
5 B 2 9
6 B 3 14
7 C 1 10
8 C 2 16
9 C 3 19
现在假设我们在 ggplot2 中创建以下线图来可视化每家商店每周的总销售额:
 library (ggplot2)

#create line plot
ggplot(df, aes(x=week, y=sales, group=store, color=store)) +
    geom_line(size= 2 )
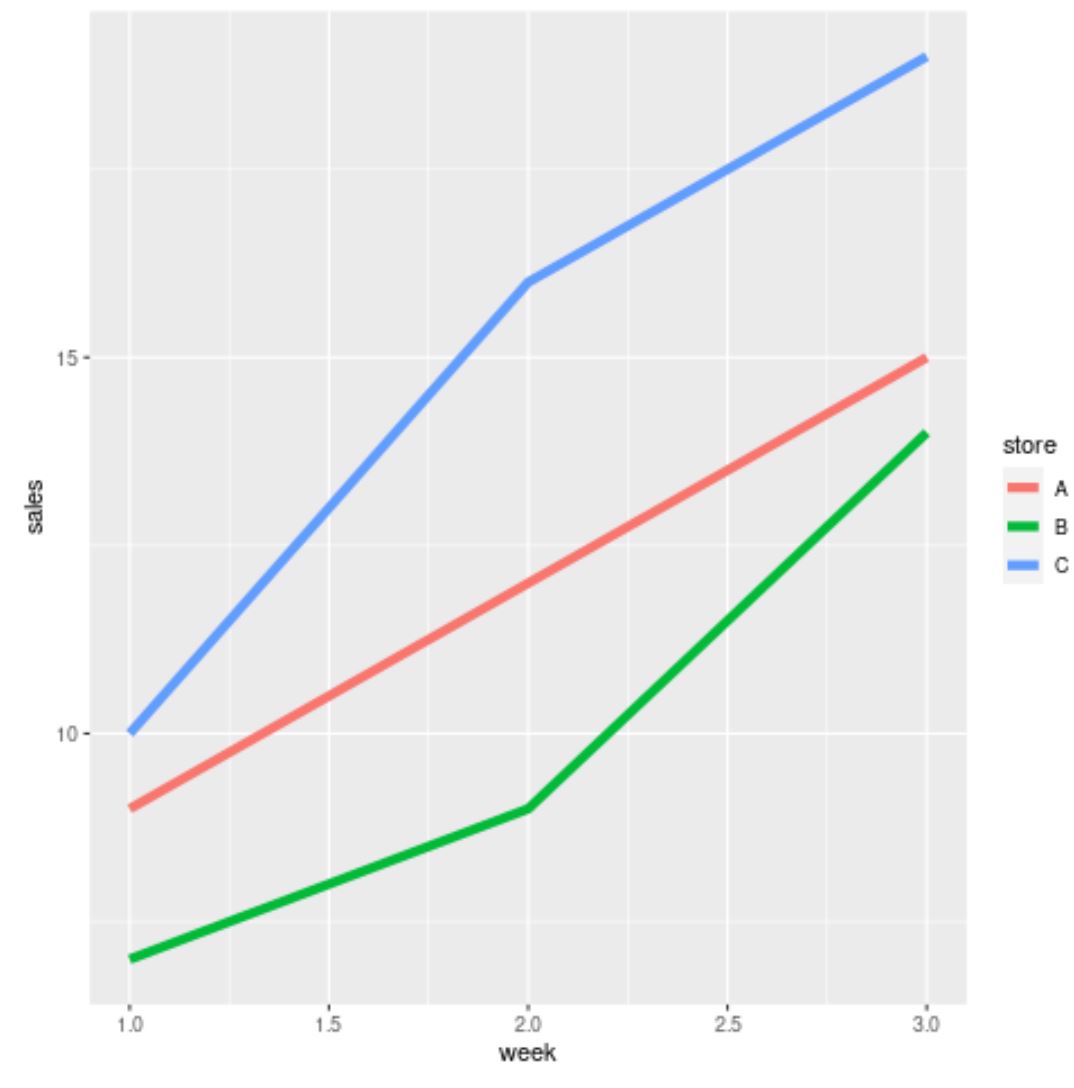
默认情况下,ggplot2 使用默认调色板,线条为红色、绿色和蓝色。
但是,您可以使用scale_color_manual()函数来指定您自己的线条颜色:
 library (ggplot2)

#create line plot
ggplot(df, aes(x=week, y=sales, group=store, color=store)) +
    geom_line(size= 2 ) +
    scale_color_manual(values=c(' orange ', ' pink ', ' red '))
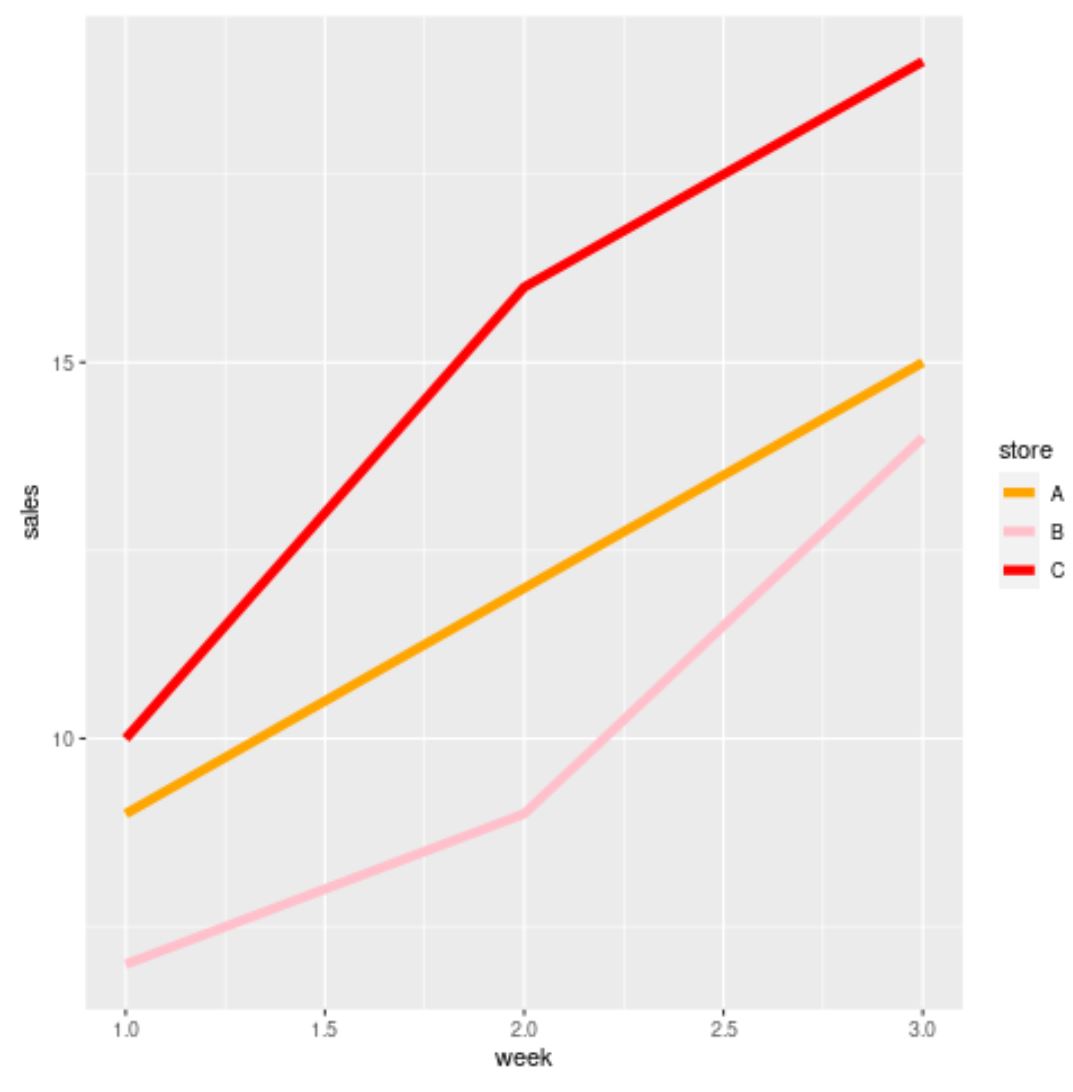
现在的颜色是橙色、粉色和红色。
请注意,您还可以使用十六进制颜色代码来指定颜色:
 library (ggplot2)

#create line plot
ggplot(df, aes(x=week, y=sales, group=store, color=store)) +
    geom_line(size= 2 ) +
    scale_color_manual(values=c(' #063970 ', ' #A69943 ', ' #7843a6 '))
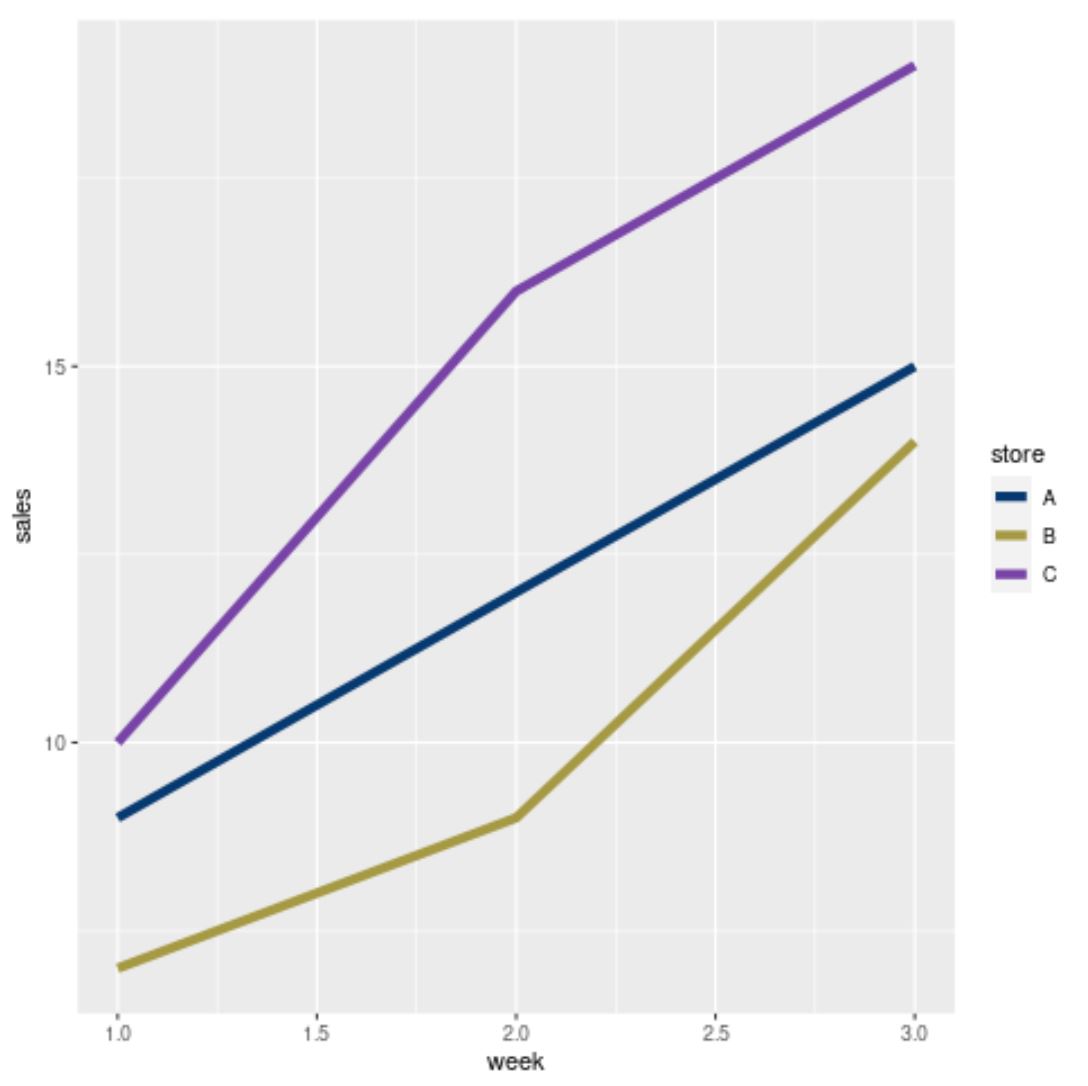
现在,颜色与我们选择的特定十六进制颜色代码相匹配。
其他资源
以下教程解释了如何在 ggplot2 中执行其他常见任务:
关于作者
本杰明·安德森博
大家好,我是本杰明,一位退休的统计学教授,后来成为 Statorials 的热心教师。 凭借在统计领域的丰富经验和专业知识,我渴望分享我的知识,通过 Statorials 增强学生的能力。了解更多