Ggplot2 标题完整指南
ggplot2数据可视化库可以轻松地在 R 中从头开始创建漂亮的图表。
但是,除非您指定,否则 ggplot2 不会提供图表标题。本教程准确解释了如何在 ggplot2 图表上添加和编辑标题。
如何添加 ggplot2 标题
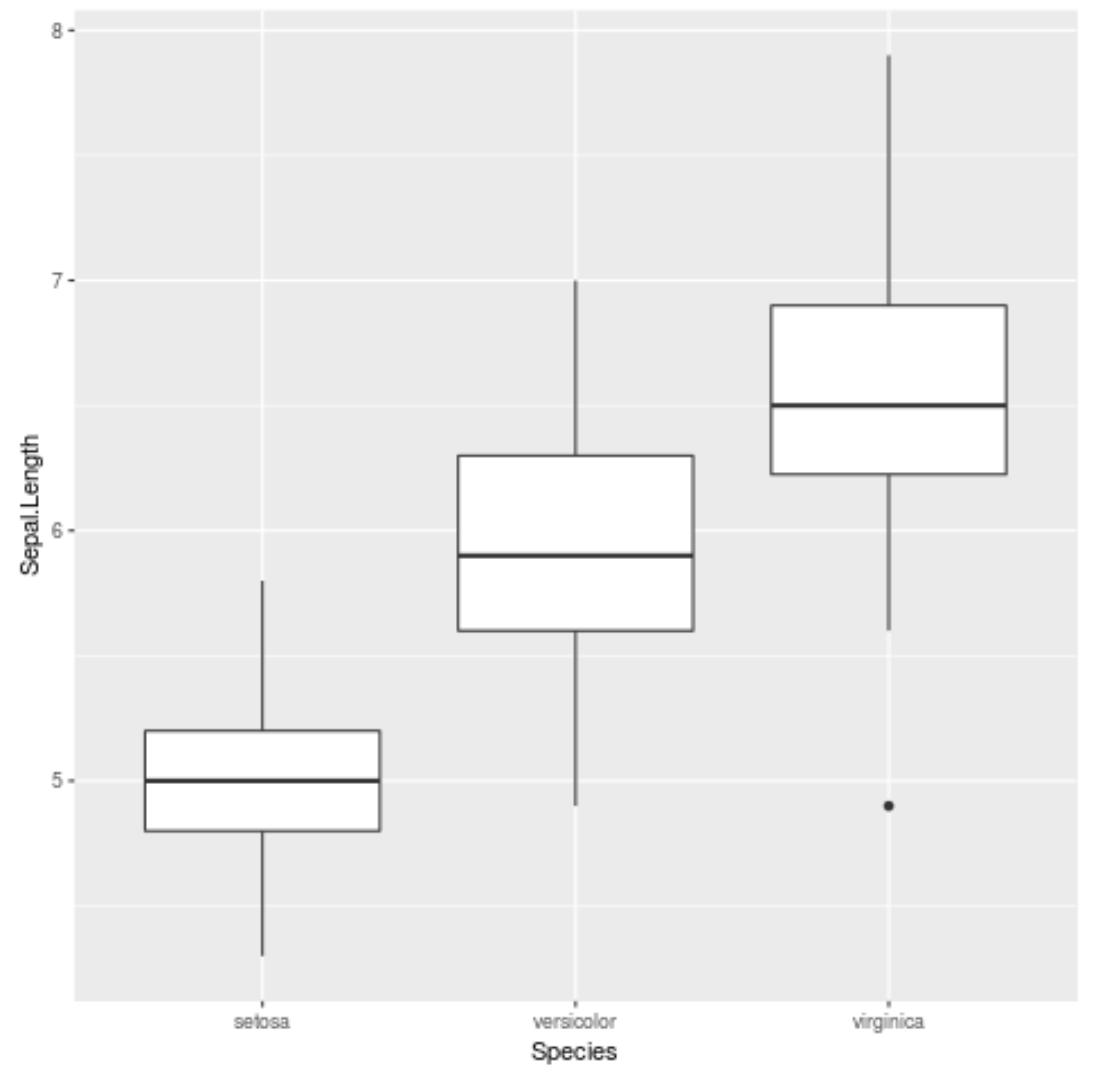
以下代码演示了如何使用 ggplot2 使用内置iris数据集创建分组箱线图:
 library (ggplot2)

ggplot(iris, aes (x= Species , y= Sepal.Length )) +
  geom_boxplot()
要向图表添加标题,我们可以使用ggtitle()函数:
 ggplot(iris, aes (x= Species , y= Sepal.Length )) +
  geom_boxplot() +
  ggtitle(' Sepal Length by Species ')
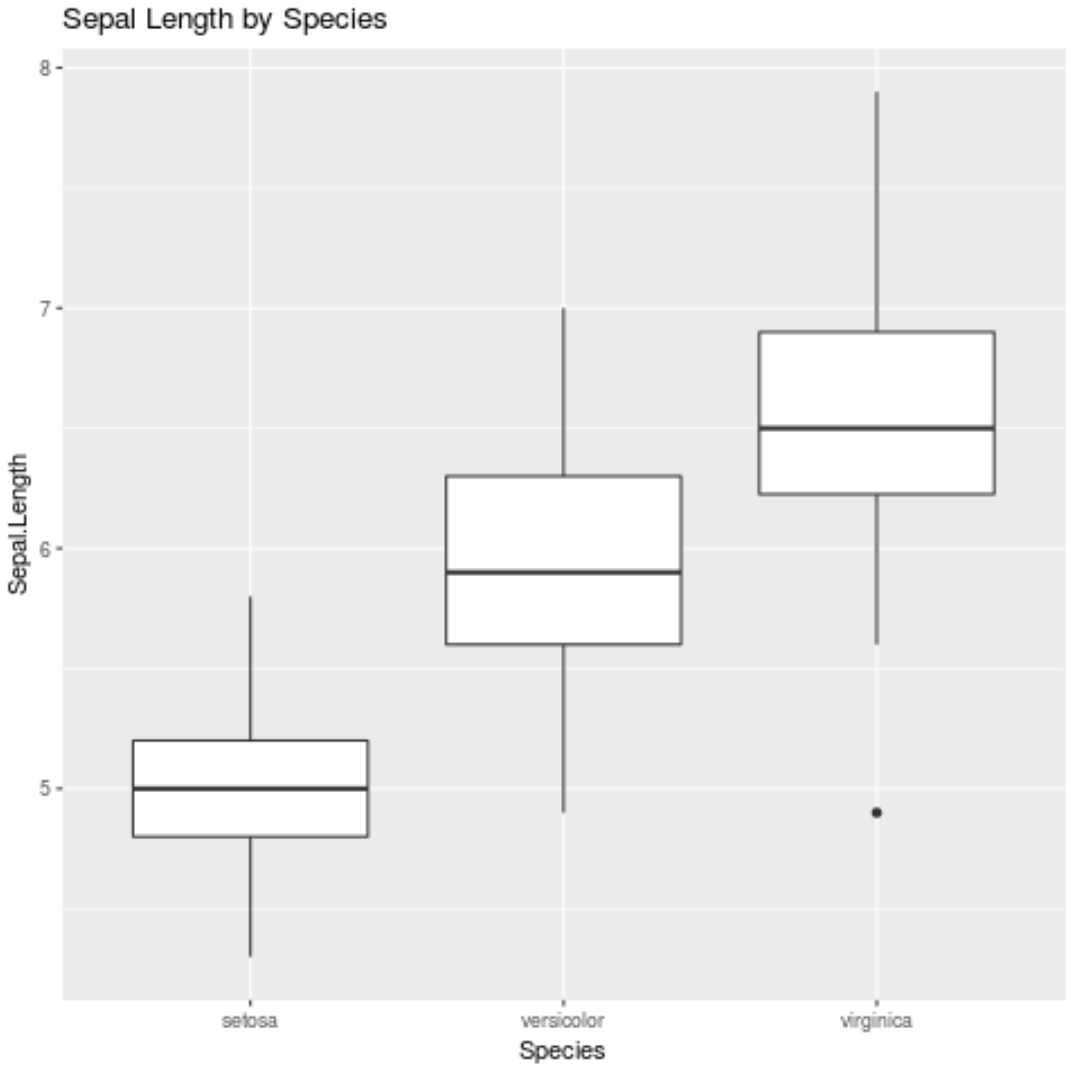
注意:您还可以使用labs(title=’Sepal length by Species’)创建完全相同的标题。
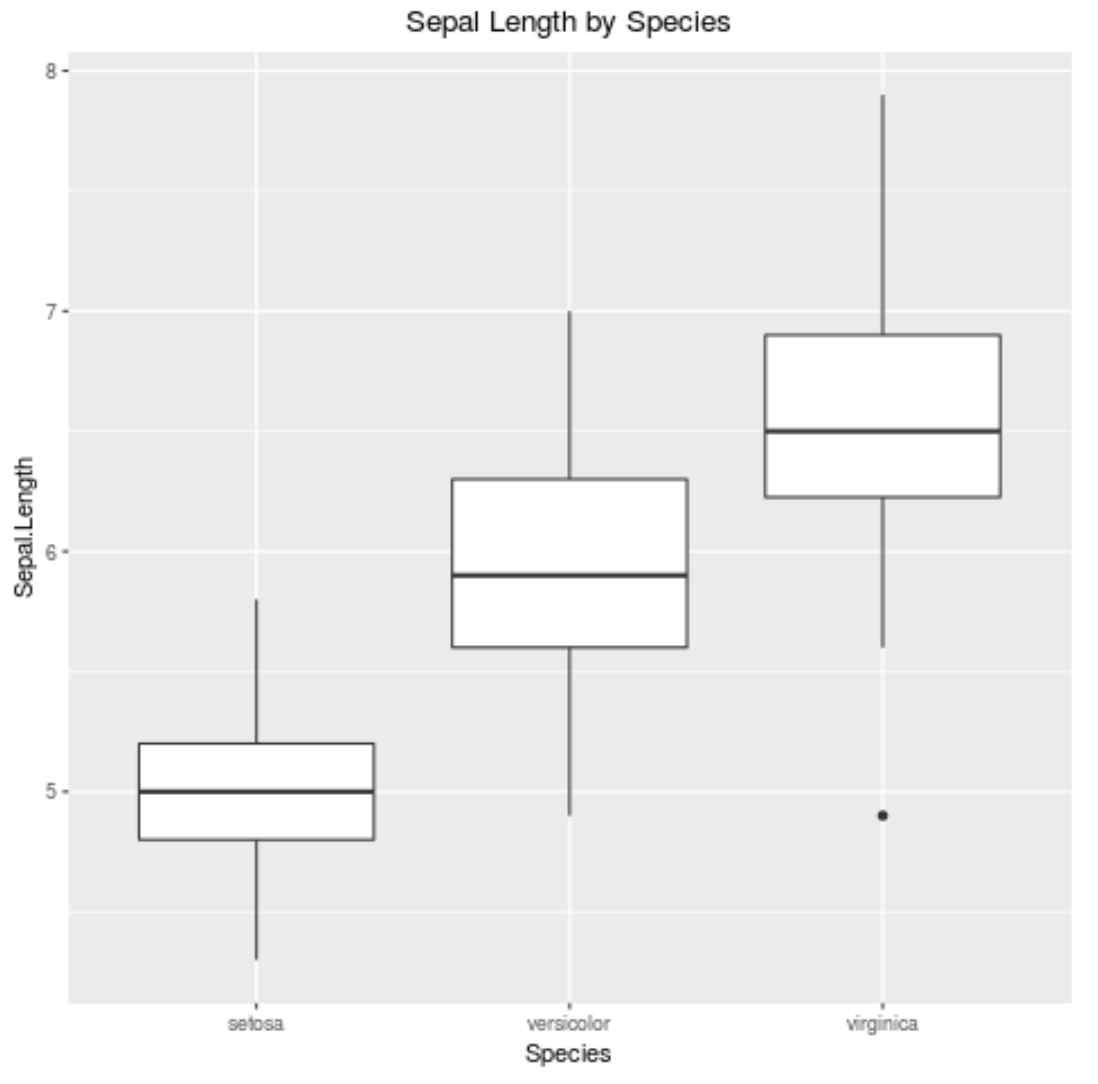
如何将 ggplot2 标题居中
默认情况下,ggplot2 标题左对齐。 ggplot2 创建者 Hadley Wickham 指出,这是因为左对齐标题与字幕配合使用效果更好。
如果你想让ggplot2标题居中,你可以使用这段代码:
theme(plot.title = element_text (hjust = 0.5 ))
实际情况如下:
 ggplot(iris, aes (x= Species , y= Sepal.Length )) +
  geom_boxplot() +
  ggtitle(' Sepal Length by Species ') +
  theme(plot.title = element_text (hjust = 0.5 ))
如何更改 ggplot2 标题的字体
您可以更改字体标题的许多方面,包括:
- 系列:字体系列
- 面:字体的面。选项包括“斜体”、“粗体”和“粗体斜体”。
- 颜色:字体颜色
- size :字体大小(以磅为单位)
- hjust : 0 到 1 之间的水平对齐
- vjust : 0 和 1 之间的垂直对齐
- lineheight :行高,即多行标题的行间距
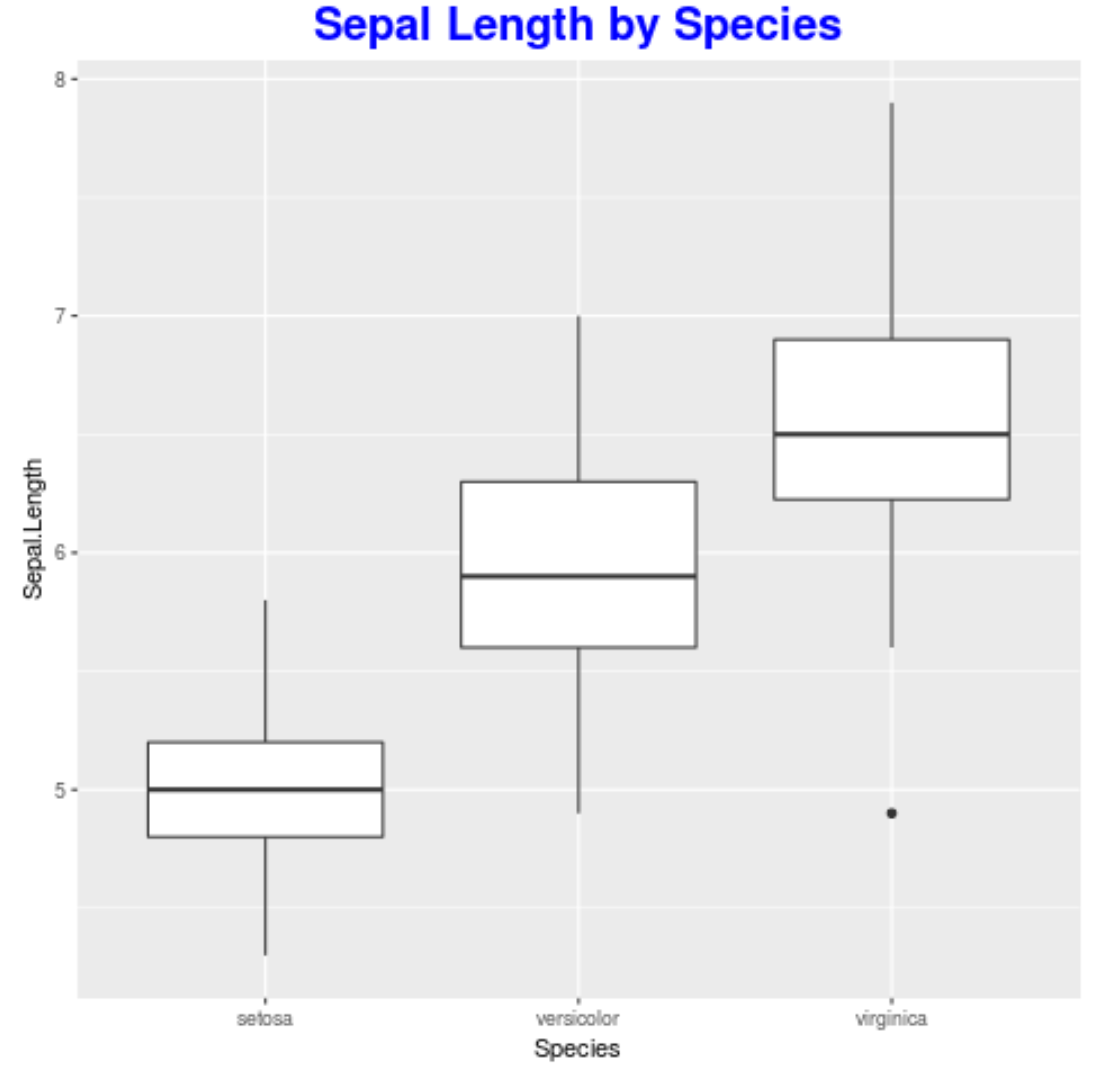
以下是如何修改其中一些方面的示例:
 ggplot(iris, aes (x= Species , y= Sepal.Length )) +
  geom_boxplot() +
  ggtitle(' Sepal Length by Species ') +
  theme(plot.title = element_text (hjust= 0.5 , color=" blue ", size= 20 , face=" bold "))
如何创建多行 ggplot2 标题
如果您的标题异常长,您只需在想要新行开始的位置添加\n即可。例如:
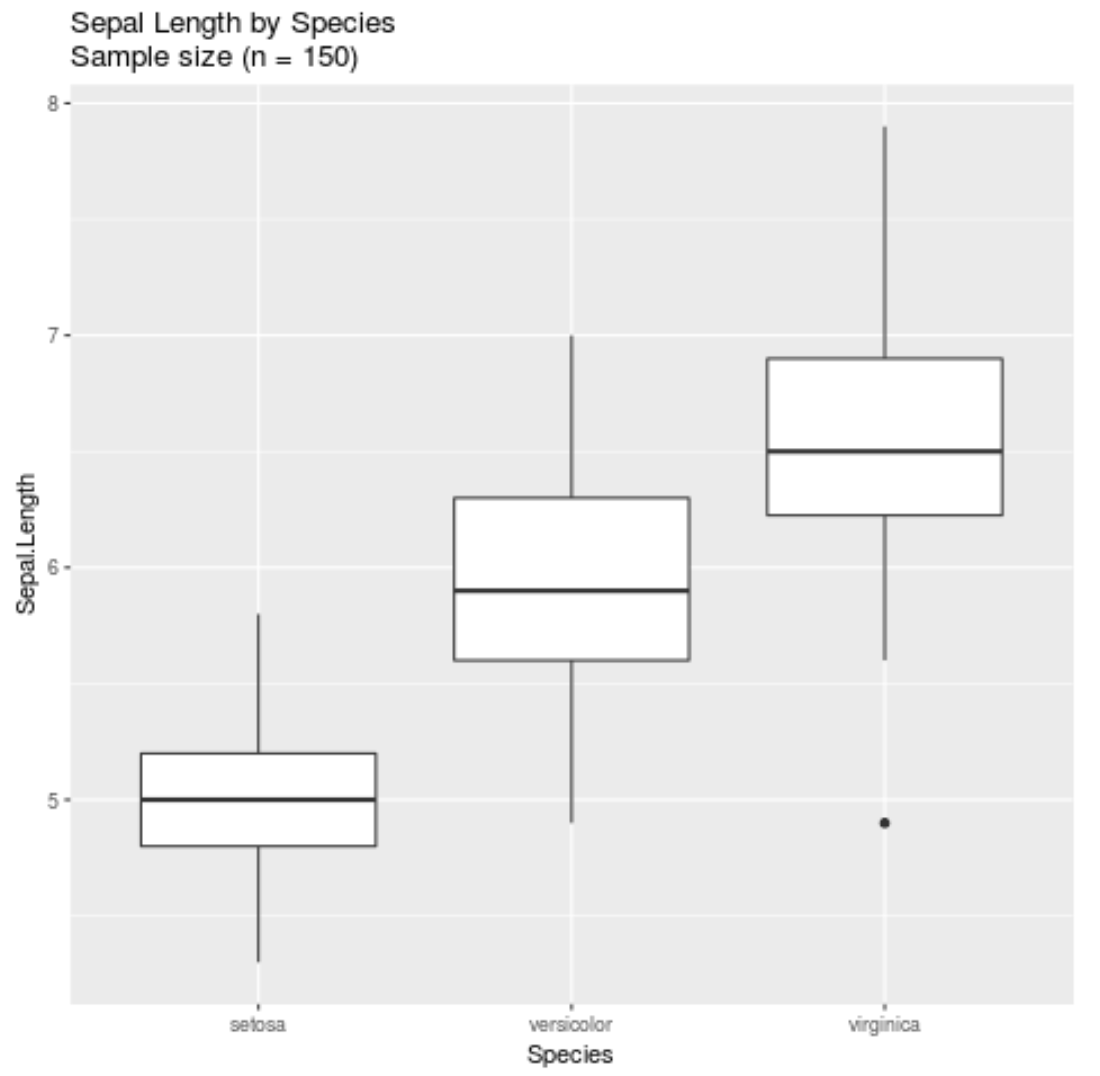
 ggplot(iris, aes (x= Species , y= Sepal.Length )) +
  geom_boxplot() +
  ggtitle(' Sepal Length by Species\nSample size (n = 150) ')
其他资源
关于作者
本杰明·安德森博
大家好,我是本杰明,一位退休的统计学教授,后来成为 Statorials 的热心教师。 凭借在统计领域的丰富经验和专业知识,我渴望分享我的知识,通过 Statorials 增强学生的能力。了解更多