如何在 ggplot2 中绘制线性回归线(附示例)
您可以使用 R 可视化库ggplot2使用以下基本语法绘制拟合线性回归模型:
 ggplot(data,aes(x, y)) +
  geom_point() +
  geom_smooth(method=' lm ')
以下示例展示了如何在实践中使用此语法。
示例:在 ggplot2 中绘制线性回归线
假设我们将一个简单的线性回归模型拟合到以下数据集:
 #create dataset
data <- data.frame(y=c(6, 7, 7, 9, 12, 13, 13, 15, 16, 19, 22, 23, 23, 25, 26),
                   x=c(1, 2, 2, 3, 4, 4, 5, 6, 6, 8, 9, 9, 11, 12, 12))

#fit linear regression model to dataset and view model summary
model <- lm(y~x, data=data)
summary(model)

Call:
lm(formula = y ~ x, data = data)

Residuals:
    Min 1Q Median 3Q Max
-1.4444 -0.8013 -0.2426 0.5978 2.2363

Coefficients:
            Estimate Std. Error t value Pr(>|t|)
(Intercept) 4.20041 0.56730 7.404 5.16e-06 ***
x 1.84036 0.07857 23.423 5.13e-12 ***
---
Significant. codes: 0 '***' 0.001 '**' 0.01 '*' 0.05 '.' 0.1 ' ' 1

Residual standard error: 1.091 on 13 degrees of freedom
Multiple R-squared: 0.9769, Adjusted R-squared: 0.9751
F-statistic: 548.7 on 1 and 13 DF, p-value: 5.13e-12
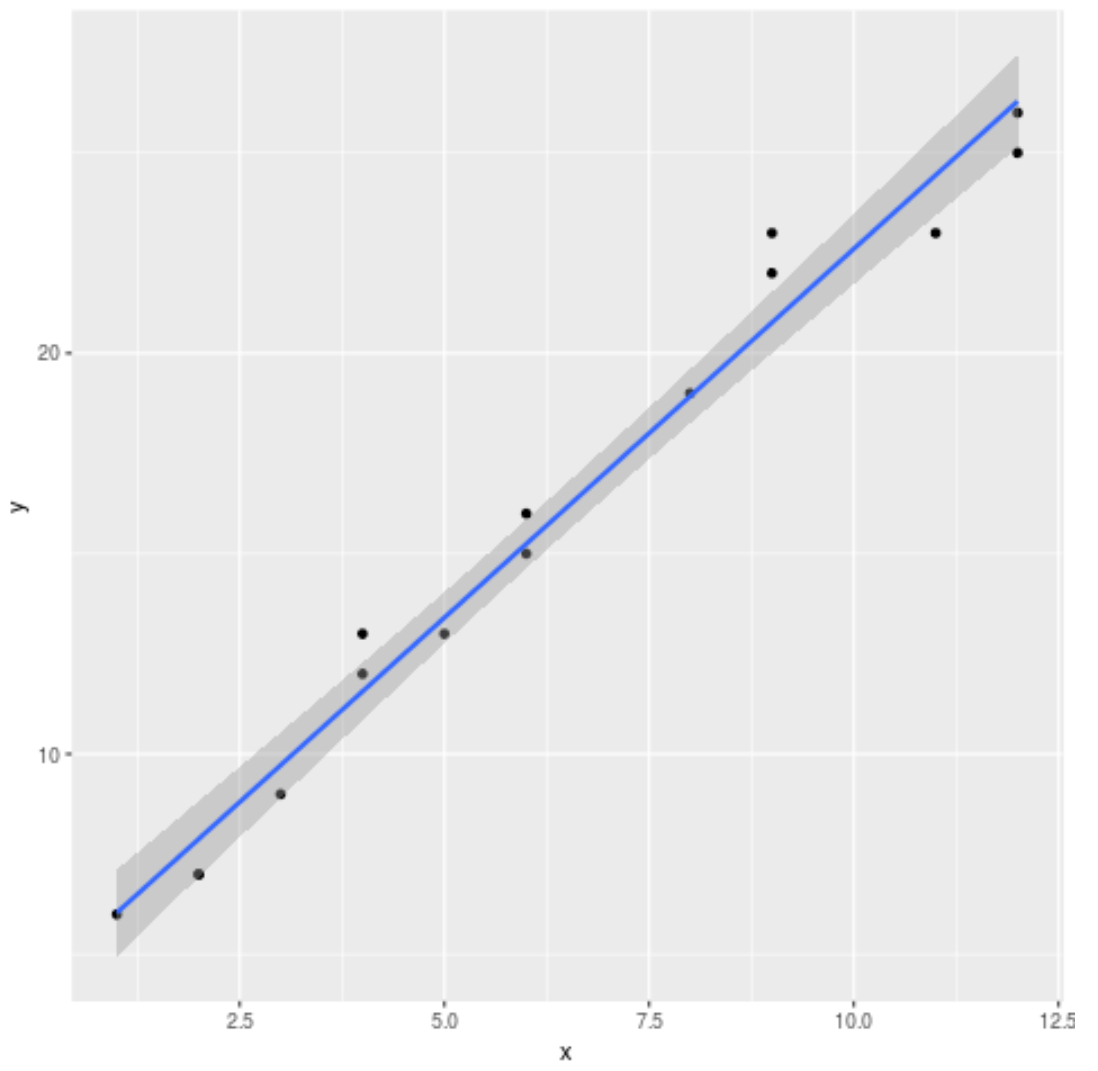
以下代码显示了如何可视化拟合的线性回归模型:
 library (ggplot2)

#create plot to visualize fitted linear regression model
ggplot(data,aes(x, y)) +
  geom_point() +
  geom_smooth(method=' lm ')

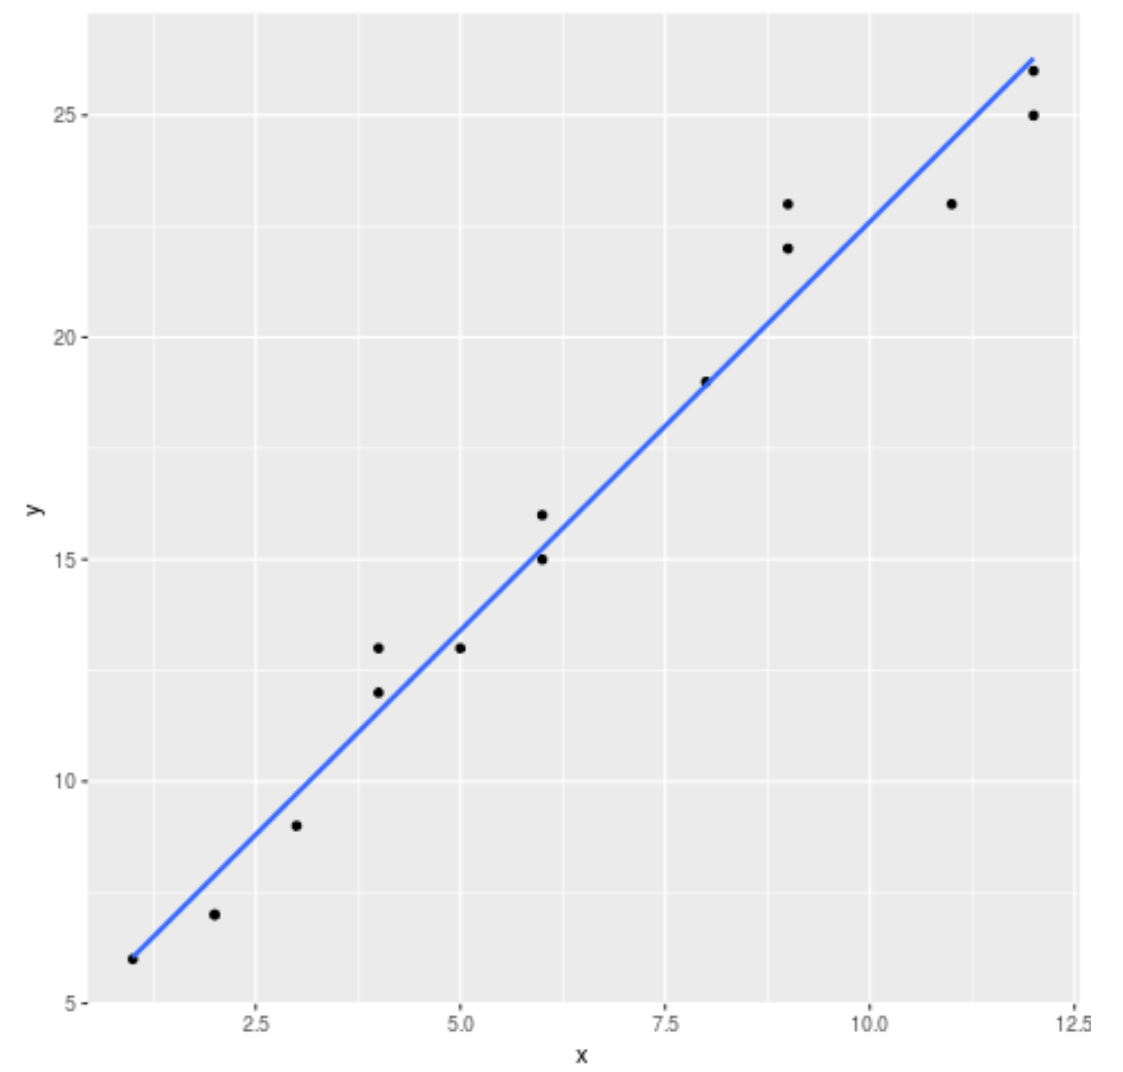
默认情况下,ggplot2 向图表添加标准误差线。您可以使用se=FALSE参数禁用它们,如下所示:
 library (ggplot2)

#create regression plot with no standard error lines
ggplot(data,aes(x, y)) +
  geom_point() +
  geom_smooth(method=' lm ', se= FALSE )

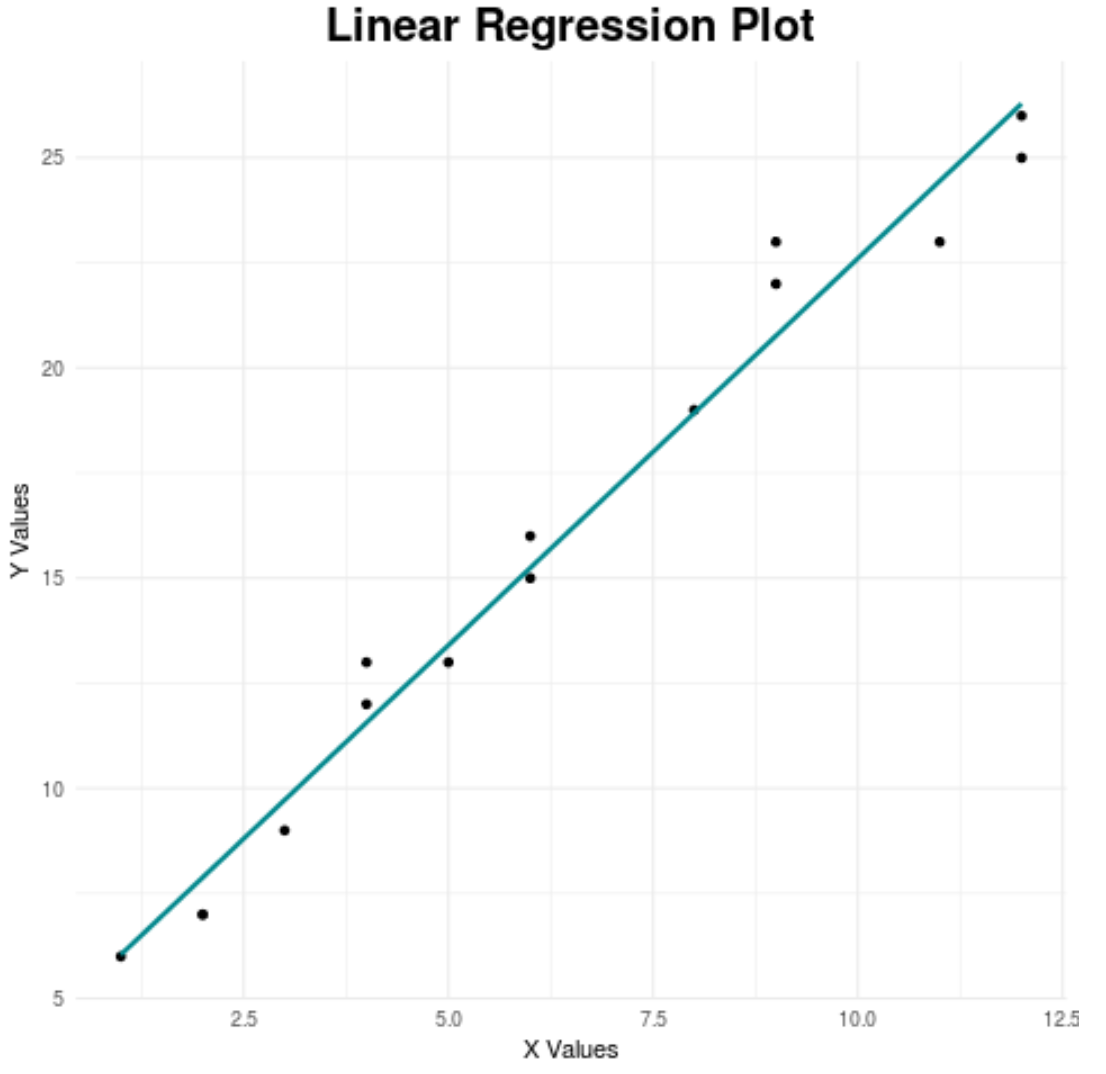
最后,我们可以自定义图表的某些方面,使其更具视觉吸引力:
 library (ggplot2)

#create regression plot with customized style
ggplot(data,aes(x, y)) +
  geom_point() +
  geom_smooth(method=' lm ', se= FALSE , color=' turquoise4 ') +
  theme_minimal() +
  labs(x=' X Values ', y=' Y Values ', title=' Linear Regression Plot ') +
  theme(plot.title = element_text(hjust=0.5, size=20, face=' bold '))

请参阅本文以获取最佳 ggplot2 主题的完整指南。