如何在 ggplot2 中对区域进行着色(带有示例)
您可以使用以下基本语法对 ggplot2 图中的特定区域进行着色:
 ggplot(df, aes(x=x, y=y)) +
  geom_point() +
  annotate(' rect ', xmin= 3 , xmax= 5 , ymin= 3 , ymax= 7 , alpha= .2 , fill=' red ')
这个特定示例对 x 值 3 和 5 以及 y 值 3 和 7 之间的区域进行了着色。
fill参数控制阴影区域的颜色, alpha参数控制颜色的透明度。
以下示例展示了如何在实践中使用此语法。
示例:在 ggplot2 中对区域进行着色
假设我们在 R 中有以下数据框,其中包含有关各个篮球运动员得分和篮板的信息:
 #create data frame
df <- data. frame (points=c(3, 3, 5, 6, 7, 8, 9, 9, 8, 5),
                 rebounds=c(2, 6, 5, 5, 8, 5, 9, 9, 8, 6))

#view data frame
df

   rebound points
1 3 2
2 3 6
3 5 5
4 6 5
5 7 8
6 8 5
7 9 9
8 9 9
9 8 8
10 5 6
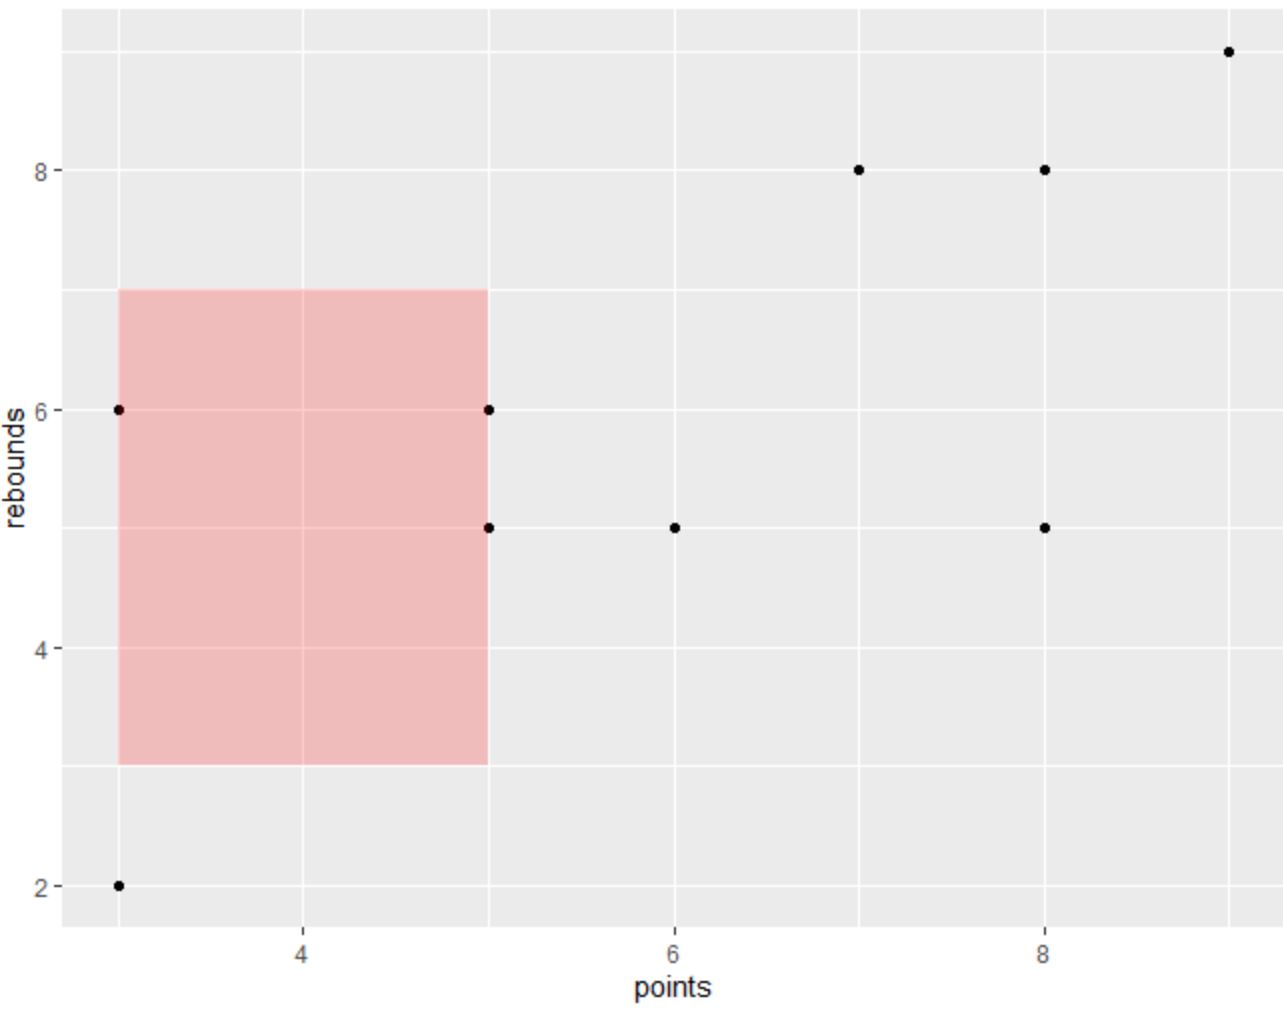
我们可以使用以下代码创建散点图,并用浅红色矩形对 3 和 5 的 x 值以及 3 和 7 的 y 值之间的区域进行着色:
 library (ggplot2)

#create scatter plot with shaded area
ggplot(df, aes(x=x, y=y)) +
  geom_point() +
  annotate(' rect ', xmin= 3 , xmax= 5 , ymin= 3 , ymax= 7 , alpha= .2 , fill=' red ')

我们在annotate()函数中指定的区域带有浅红色矩形阴影。
请注意,alpha 参数的值范围为 0 到 1,值越低表示透明度越高。
例如,如果我们将alpha值更改为 0.5,则阴影区域的颜色会更暗:
 library (ggplot2)

#create scatter plot with shaded area
ggplot(df, aes(x=x, y=y)) +
  geom_point() +
  annotate(' rect ', xmin= 3 , xmax= 5 , ymin= 3 , ymax= 7 , alpha= .5 , fill=' red ')

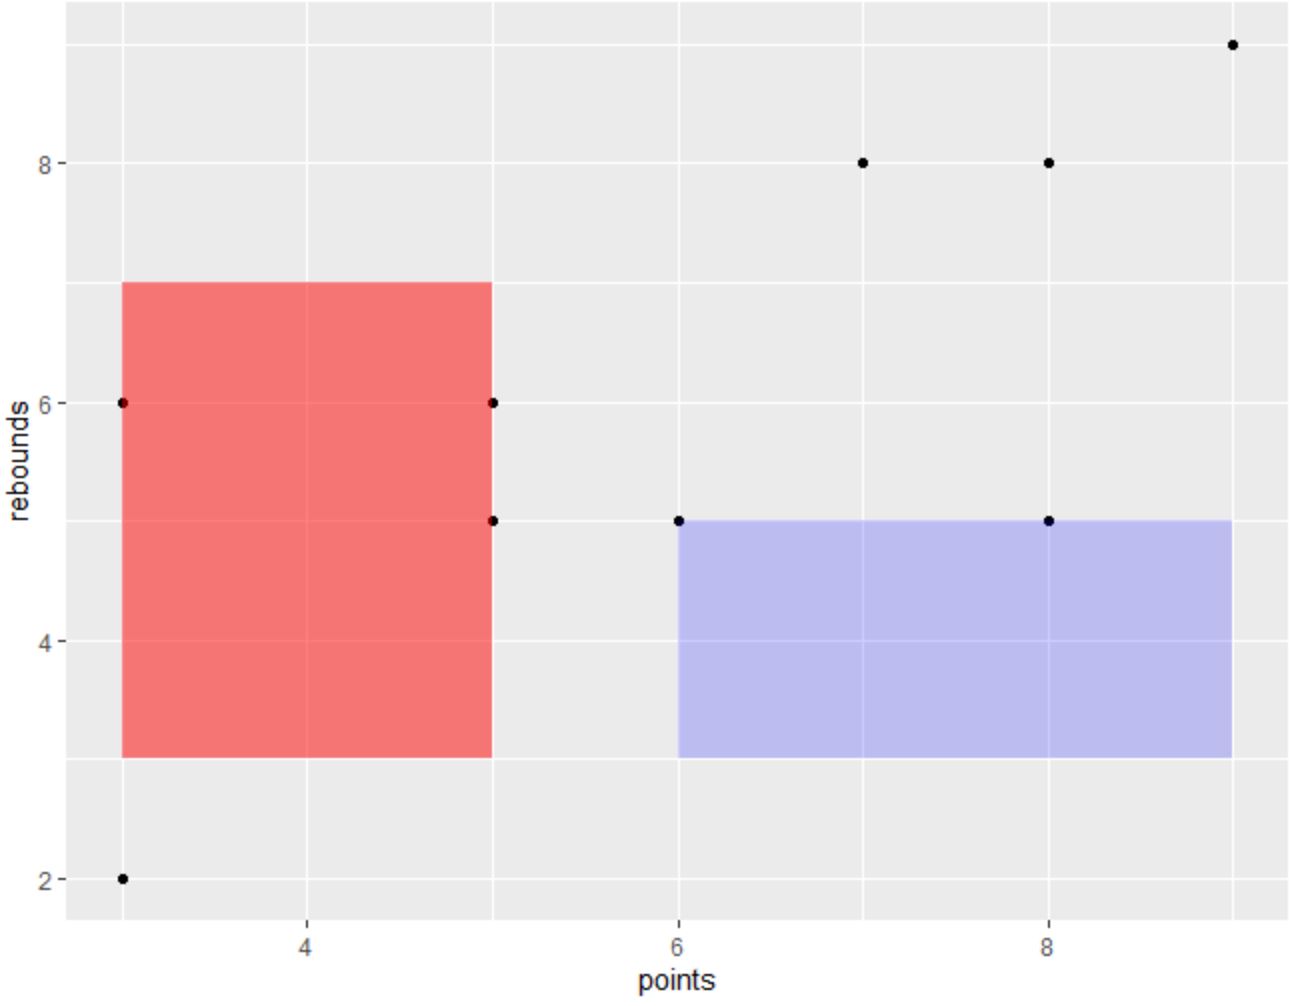
另请注意,您可以多次使用annotate()函数在绘图中创建多个阴影区域:
 library (ggplot2)

#create scatter plot with two shaded areas
ggplot(df, aes(x=x, y=y)) +
  geom_point() +
  annotate(' rect ', xmin= 3 , xmax= 5 , ymin= 3 , ymax= 7 , alpha= .5 , fill=' red ')

请随意使用annotate()函数的参数来创建您想要的绘图中的精确阴影。
其他资源
以下教程解释了如何在 R 中执行其他常见任务:
如何向 ggplot2 绘图添加文本
如何删除ggplot2中的网格线
如何更改ggplot2中的X轴标签