如何在ggplot2中设置轴标签位置(带有示例)
您可以使用以下语法更改 ggplot2 中的轴标签位置:
 theme(axis. title . x = element_text(margin=margin(t= 20 )), #add margin to x-axis title
      axis. title . y = element_text(margin=margin(r= 60 ))) #add margin to y-axis title
请注意,您可以为 margin 参数指定t 、 r 、 b 、 l ,这意味着上、右、下和左。
以下示例展示了如何在实践中使用此语法。
示例1:设置标签在X轴上的位置
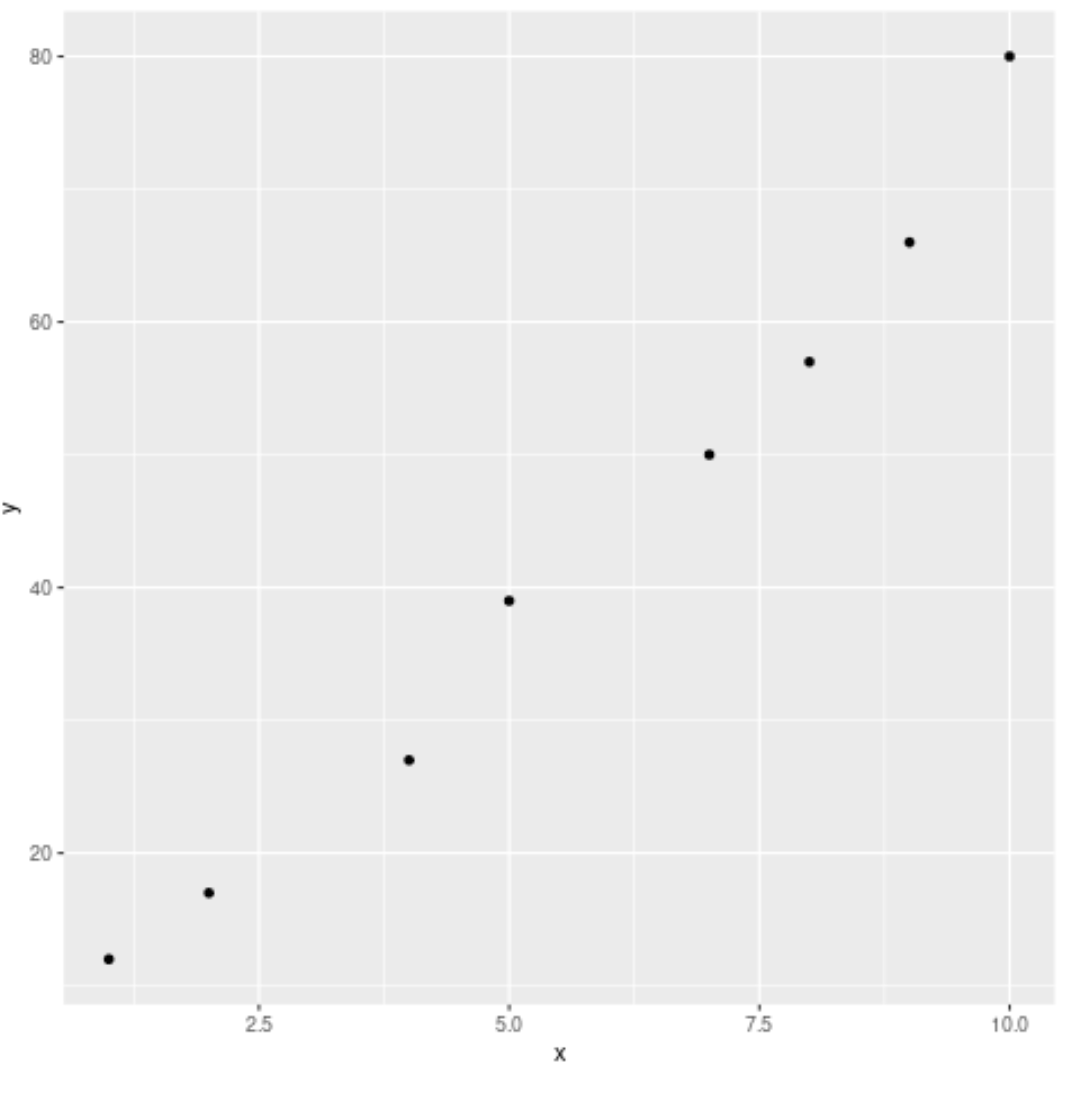
假设我们使用 ggplot2 创建以下散点图:
 library (ggplot2)

#create data frame
df <- data. frame (x=c(1, 2, 4, 5, 7, 8, 9, 10),
                 y=c(12, 17, 27, 39, 50, 57, 66, 80))

#create scatterplot of x vs. y
ggplot(df, aes(x=x, y=y)) +
  geom_point()

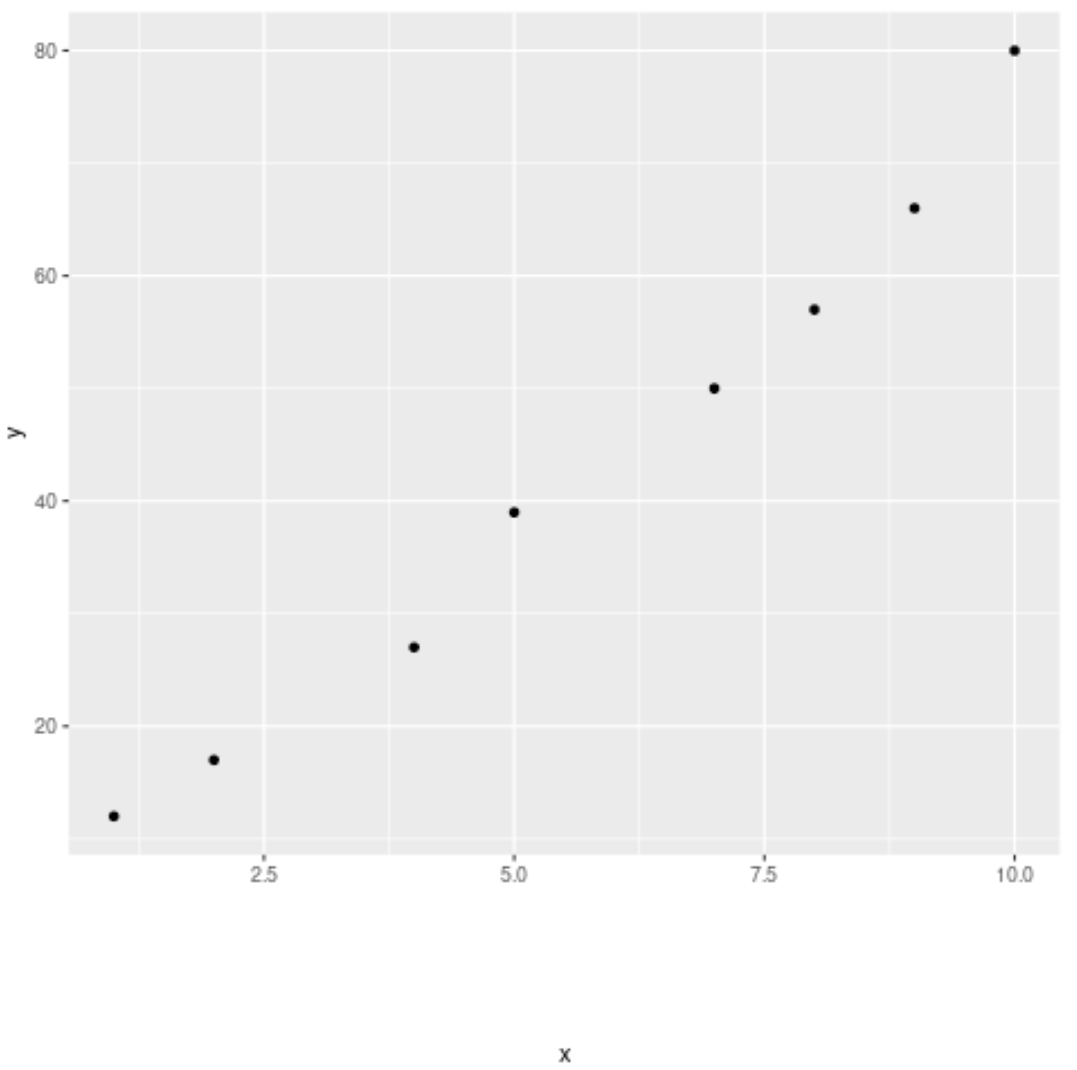
我们可以在 X 轴标题的顶部添加边距,使 X 轴标题看起来离轴更远:
 #create scatterplot of x vs. y with margin added on x-axis title
ggplot(df, aes(x=x, y=y)) +
  geom_point() +
  theme(axis. title . x = element_text(margin = margin(t = 70 )))

请注意,我们在 x 轴标题和 x 轴之间添加了显着的间距。
示例2:设置标签在Y轴上的位置
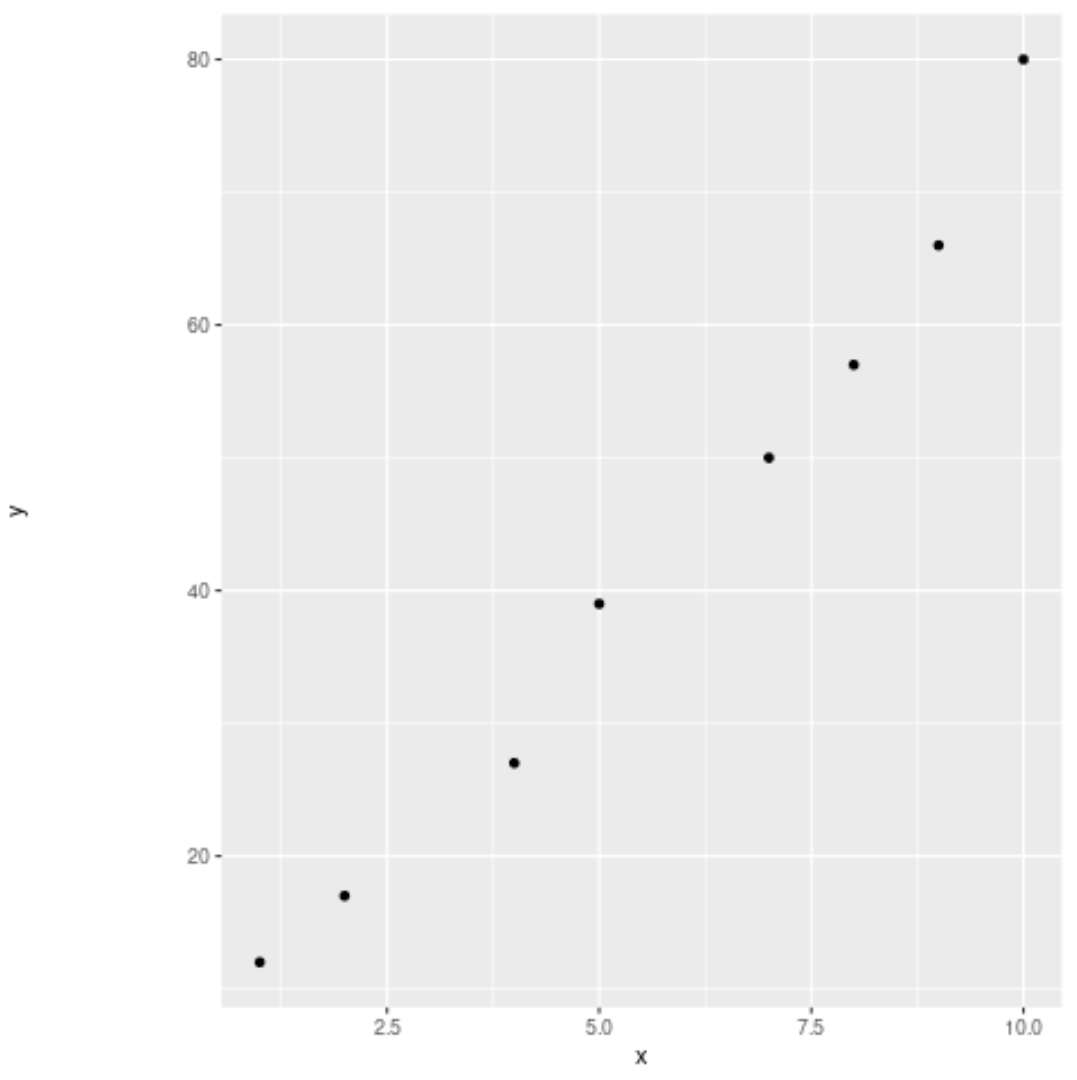
我们可以使用以下代码在 y 轴标题右侧添加边距,使 y 轴标题显示得离轴更远:
 #create scatterplot of x vs. y with margin added on y-axis title
ggplot(df, aes(x=x, y=y)) +
  geom_point() +
  theme(axis. title . y = element_text(margin = margin(r = 70 )))

请注意,我们在 y 轴标题和 y 轴之间添加了显着的间距。
其他资源
以下教程解释了如何在ggplot2中执行其他常用操作:
如何在ggplot2中旋转轴标签
如何在ggplot2中设置轴中断
如何在ggplot2中设置轴限制
如何更改ggplot2中的图例标签