如何在 matplotlib 中绘制时间序列(附示例)
您可以使用以下语法在 Matplotlib 中绘制时间序列:
 import matplotlib. pyplot as plt

plt. plot (df. x , df. y )
这假设变量 x 属于datetime.datetime()类。
以下示例展示了如何使用此语法在 Python 中绘制时间序列数据。
示例 1:在 Matplotlib 中绘制基本时间序列
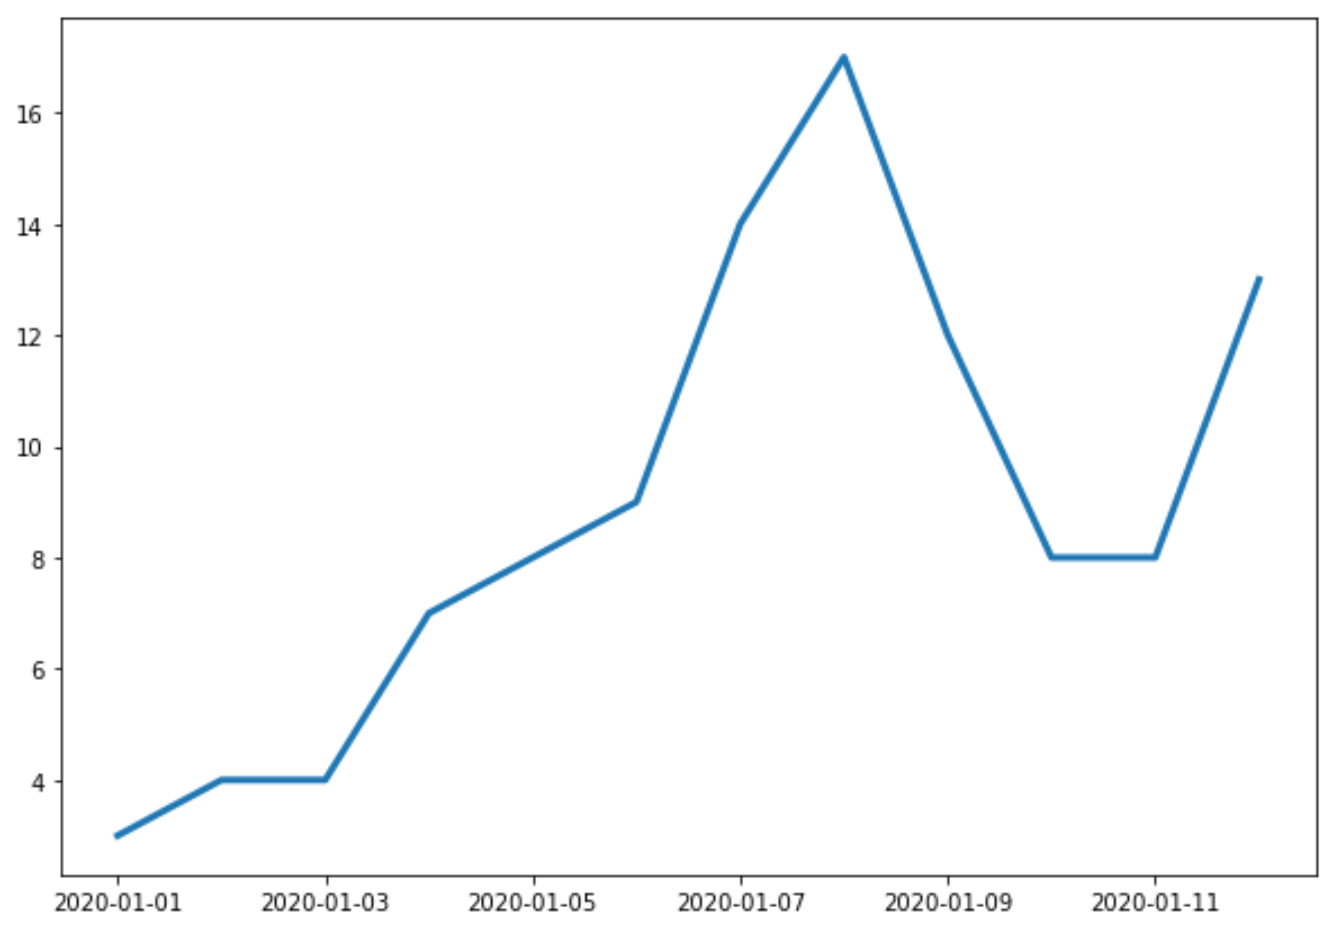
以下代码展示了如何在 Matplotlib 中绘制时间序列,显示企业连续 12 天的总销售额:
 import matplotlib. pyplot as plt
import datetime
import numpy as np
import pandas as pd

#define data
df = pd. DataFrame ({' date ': np. array ([datetime. datetime (2020, 1, i+1)
for i in range(12)]),
                   ' sales ': [3, 4, 4, 7, 8, 9, 14, 17, 12, 8, 8, 13]})

#plot time series
plt. plot (df. date , df. sales , linewidth= 3 )

X 轴显示日期,Y 轴显示每个日期的总销售额。
示例 2:自定义标题和轴标签
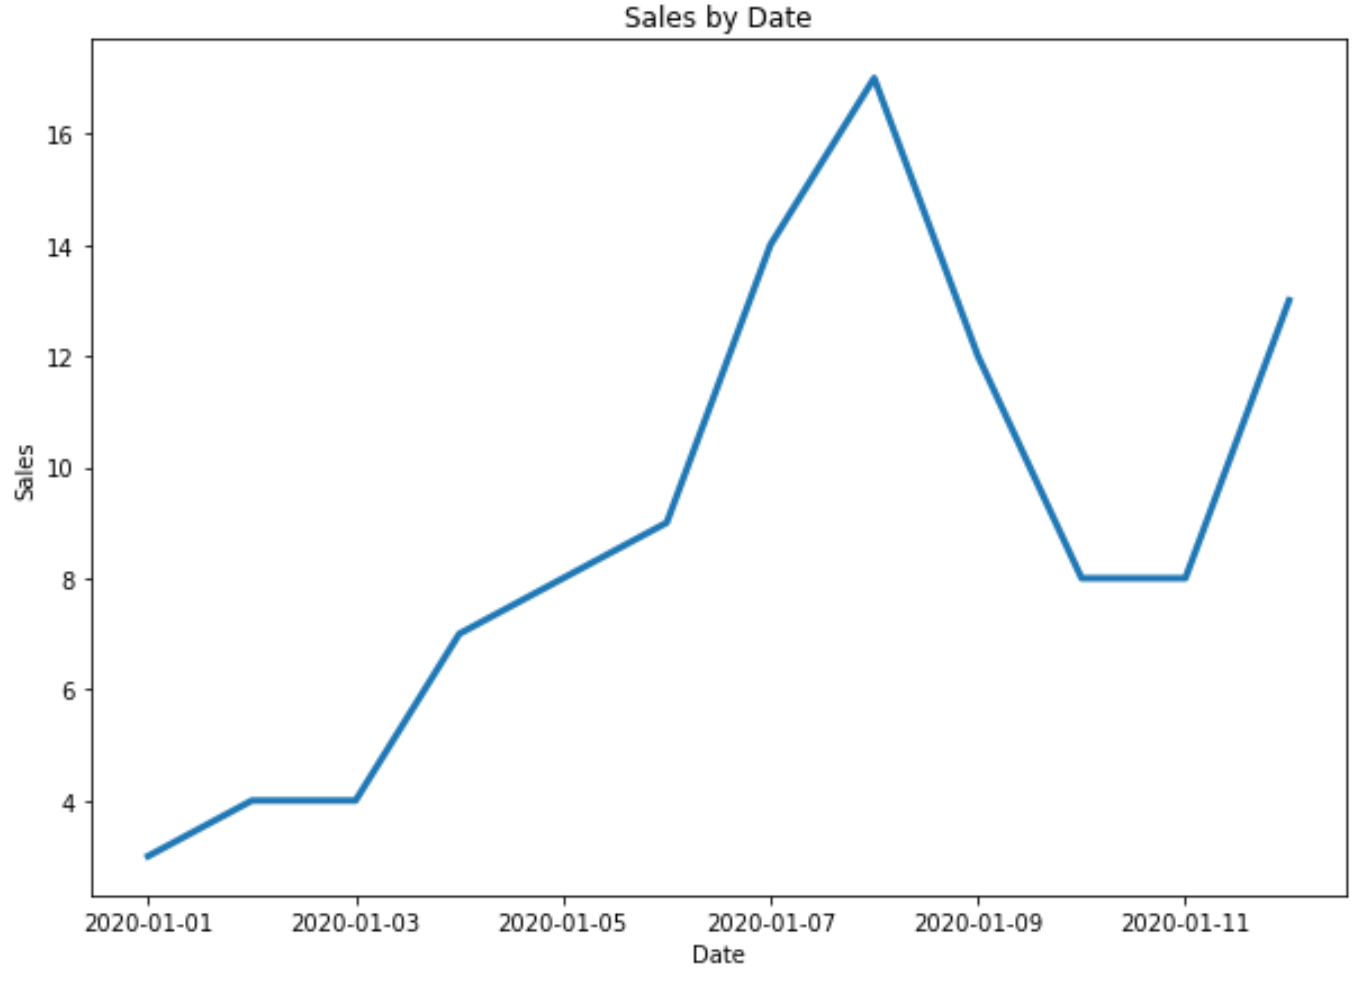
您可以使用以下代码向绘图添加标题和轴标签:
 import matplotlib. pyplot as plt
import datetime
import numpy as np
import pandas as pd

#define data
df = pd. DataFrame ({' date ': np. array ([datetime. datetime (2020, 1, i+1)
for i in range(12)]),
                   ' sales ': [3, 4, 4, 7, 8, 9, 14, 17, 12, 8, 8, 13]})

#plot time series
plt. plot (df. date , df. sales , linewidth= 3 )

#add title and axis labels
plt. title (' Sales by Date ')
plt. xlabel (' Date ')
plt. ylabel (' Sales ')

示例 3:在 Matplotlib 中绘制多个时间序列
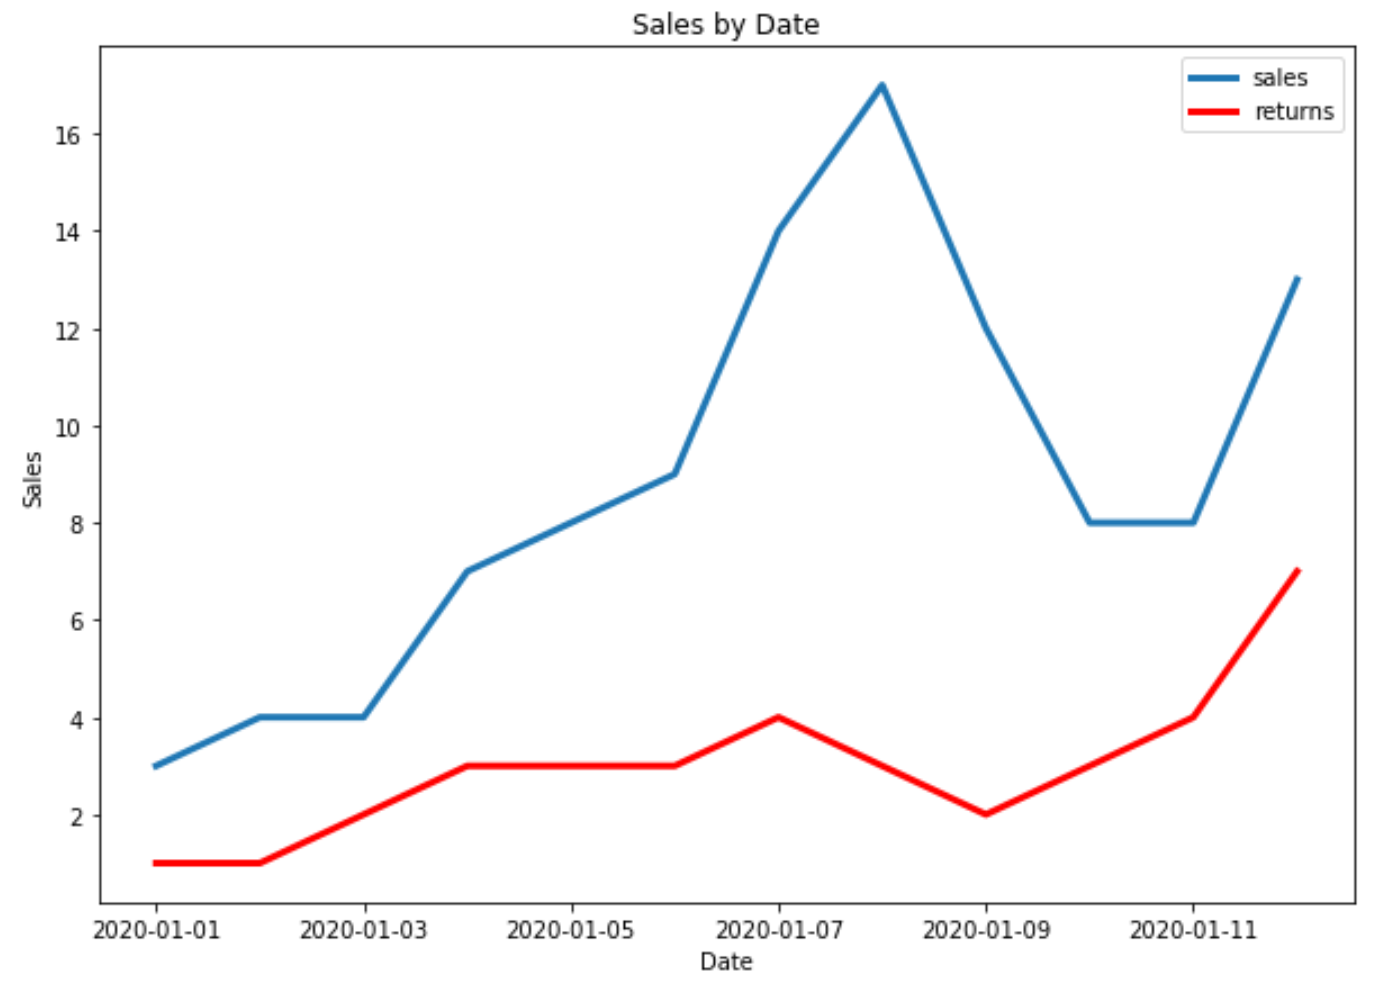
以下代码显示了如何在 Matplotlib 中的单个图中绘制多个时间序列:
 import matplotlib. pyplot as plt
import datetime
import numpy as np
import pandas as pd

#define data
df = pd. DataFrame ({' date ': np. array ([datetime. datetime (2020, 1, i+1)
                                     for i in range(12)]),
                   ' sales ': [3, 4, 4, 7, 8, 9, 14, 17, 12, 8, 8, 13]})

df2 = pd. DataFrame ({' date ': np. array ([datetime. datetime (2020, 1, i+1)
                                      for i in range(12)]),
                   ' returns ': [1, 1, 2, 3, 3, 3, 4, 3, 2, 3, 4, 7]})

#plot both time series
plt. plot ( df.date , df.sales , label=' sales ', linewidth= 3 )
plt. plot ( df2.date , df2.returns , color=' red ', label=' returns ', linewidth= 3 )

#add title and axis labels
plt. title (' Sales by Date ')
plt. xlabel (' Date ')
plt. ylabel (' Sales ')

#add legend
plt. legend ()

#displayplot
plt. show ()
