如何在 python 中使用 matplotlib 创建烛台图
烛台图是一种金融图表,显示证券随时间的价格变动。
以下示例展示了如何使用 Python 中的Matplotlib可视化库创建烛台图。
示例:用 Python 创建烛台图
假设我们有以下 pandas DataFrame,它显示了某只股票在 8 天内的开盘价、收盘价、最高价和最低价:
 import pandas as pd

#createDataFrame
prices = pd. DataFrame ({' open ': [25, 22, 21, 19, 23, 21, 25, 29],
                       ' close ': [24, 20, 17, 23, 22, 25, 29, 31],
                       ' high ': [28, 27, 29, 25, 24, 26, 31, 37],
                       ' low ': [22, 16, 14, 17, 19, 18, 22, 26]},
                       index=pd. date_range (" 2021-01-01 ", periods=8, freq=" d "))

#display DataFrame
print (prices)

            open close high low
2021-01-01 25 24 28 22
2021-01-02 22 20 27 16
2021-01-03 21 17 29 14
2021-01-04 19 23 25 17
2021-01-05 23 22 24 19
2021-01-06 21 25 26 18
2021-01-07 25 29 31 22
2021-01-08 29 31 37 26
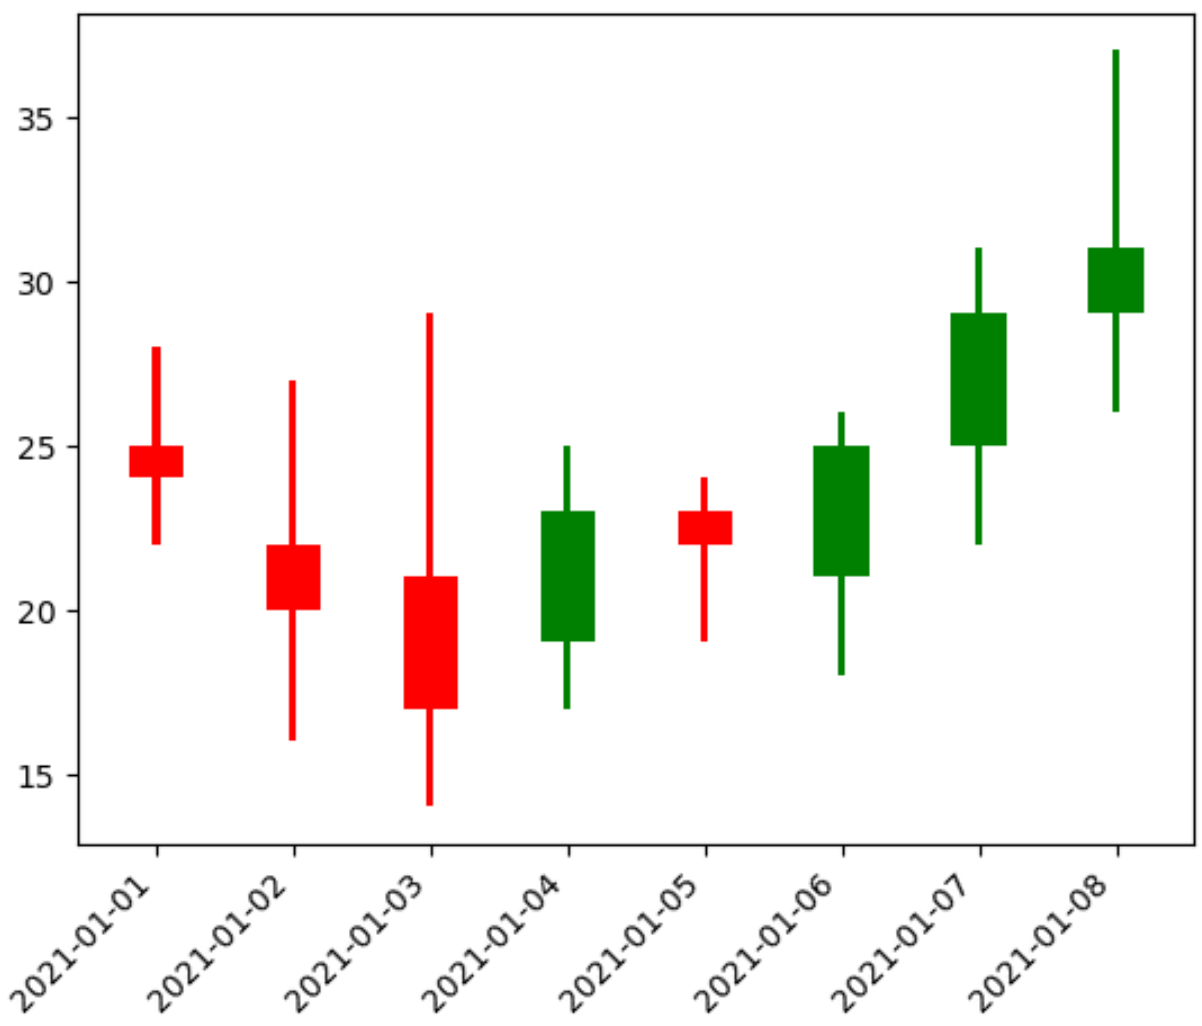
我们可以使用以下代码创建烛台图,以可视化该股票在这 8 天内的价格变动:
 import matplotlib. pyplot as plt

#create figure
plt. figure ()

#define width of candlestick elements
width = .4
width2 = .05

#define up and down prices
up = prices[prices. close >=prices. open ]
down = prices[prices. close <prices. open ]

#define colors to use
col1 = ' green '
col2 = ' red '

#plot up prices
plt. bar (up. index , up. close -up. open , width, bottom=up. open , color=col1)
plt. bar (up. index ,up. high -up. close ,width2,bottom=up. close ,color=col1)
plt. bar (up. index , up. low -up. open , width2, bottom=up. open , color=col1)

#plot down prices
plt. bar (down. index , down. close -down. open , width, bottom=down. open , color=col2)
plt. bar (down. index , down. high -down. open , width2, bottom=down. open , color=col2)
plt. bar (down. index ,down. low -down. close ,width2,bottom=down. close ,color=col2)

#rotate x-axis tick labels
plt. xticks (rotation= 45 , ha=' right ')

#display candlestick chart
plt. show ()

每个烛台代表特定日期证券价格的变化。烛台的颜色告诉我们与前一天相比收盘价格是上涨(绿色)还是下跌(红色)。
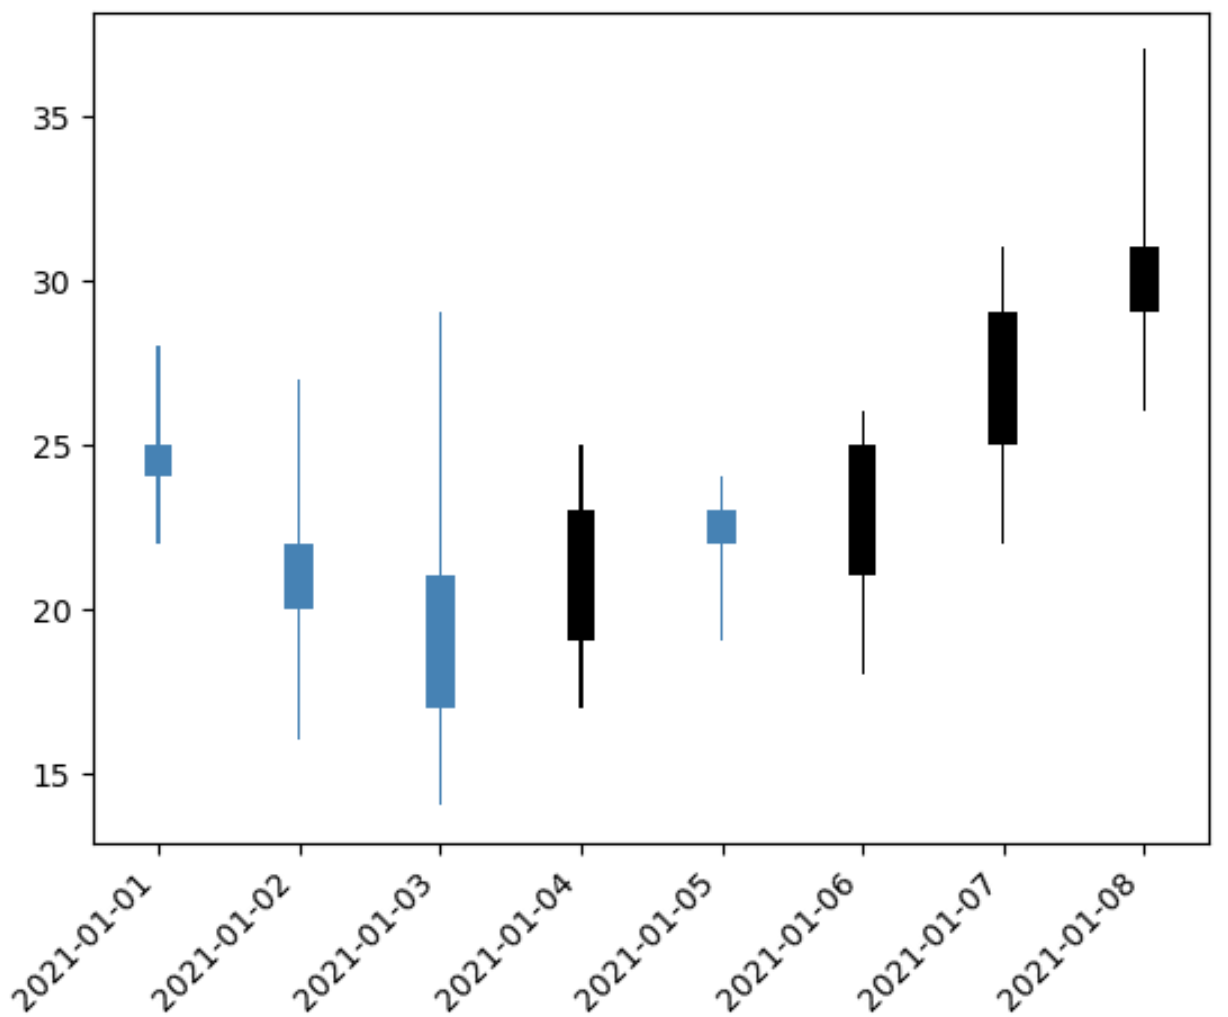
您可以随意更改烛台的宽度和颜色,以使图表按照您想要的方式显示。
例如,我们可以使蜡烛更细,并使用不同的颜色来代表“高”和“低”天:
 import matplotlib. pyplot as plt

#create figure
plt. figure ()

#define width of candlestick elements
width = .2
width2 = .02

#define up and down prices
up = prices[prices. close >=prices. open ]
down = prices[prices. close <prices. open ]

#define colors to use
col1 = ' black '
col2 = ' steelblue '

#plot up prices
plt. bar (up. index , up. close -up. open , width, bottom=up. open , color=col1)
plt. bar (up. index ,up. high -up. close ,width2,bottom=up. close ,color=col1)
plt. bar (up. index , up. low -up. open , width2, bottom=up. open , color=col1)

#plot down prices
plt. bar (down. index , down. close -down. open , width, bottom=down. open , color=col2)
plt. bar (down. index , down. high -down. open , width2, bottom=down. open , color=col2)
plt. bar (down. index ,down. low -down. close ,width2,bottom=down. close ,color=col2)

#rotate x-axis tick labels
plt. xticks (rotation= 45 , ha=' right ')

#display candlestick chart
plt. show ()

其他资源
以下教程介绍了如何在 Python 中创建其他常见图表:
如何在单个图形上创建多个 Matplotlib 图
如何在 Python 中从数据列表中绘制直方图
如何在 Python 中按组创建箱线图