如何创建具有两个 y 轴的 matplotlib 图
创建具有两个 y 轴的 Matplotlib 图的最简单方法是使用twinx()函数。
下面的例子展示了如何在实际中使用这个功能。
示例:创建具有两个 Y 轴的 Matplotlib 图
假设我们有以下两个 panda DataFrame:
 import pandas as pd

#createDataFrames
df1 = pd. DataFrame ({' year ': [1, 2, 3, 4, 5, 6, 7, 8, 9, 10],
                    ' sales ': [14, 16, 19, 22, 24, 25, 24, 24, 27, 30]})

df2 = pd. DataFrame ({' year ': [1, 2, 3, 4, 5, 6, 7, 8, 9, 10],
                    ' leads ': [4, 4, 4, 5, 4, 5, 7, 8, 5, 3]})
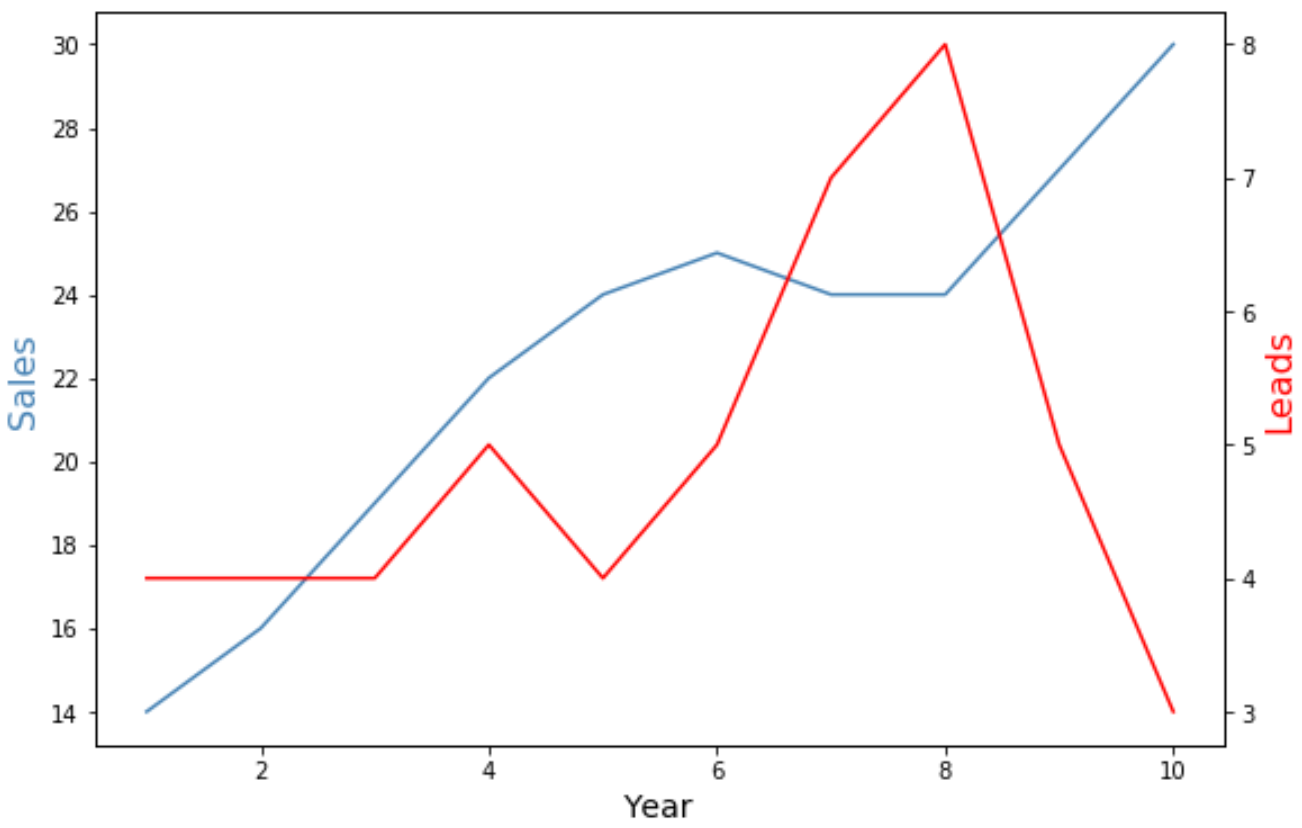
两个 DataFrame 共享范围从 1 到 10 的“年份”变量,但第一个 DataFrame 显示每年的总销售额,而第二个 DataFrame 显示每年的总销售线索。
我们可以使用以下代码创建一个 Matplotlib 图,在具有两个 Y 轴的图表上显示销售额和销售线索:
 import matplotlib. pyplot as plt

#define colors to use
col1 = ' steelblue '
col2 = ' red '

#define subplots
fig,ax = plt. subplots ()

#add first line to plot
ax. plot (df1. year , df1. sales , color=col1)

#add x-axis label
ax. set_xlabel (' Year ', fontsize= 14 )

#add y-axis label
ax. set_ylabel (' Sales ', color=col1, fontsize= 16 )

#define second y-axis that shares x-axis with current plot
ax2 = ax. twinx ()

#add second line to plot
ax2. plot (df2. year , df2. leads , color=col2)

#add second y-axis label
ax2. set_ylabel (' Leads ', color=col2, fontsize= 16 )

图表左侧的 y 轴显示每年的总销售额,图表右侧的 y 轴显示每年的总销售线索。
图中的蓝线代表每年的总销售额,红线代表每年的总销售线索。
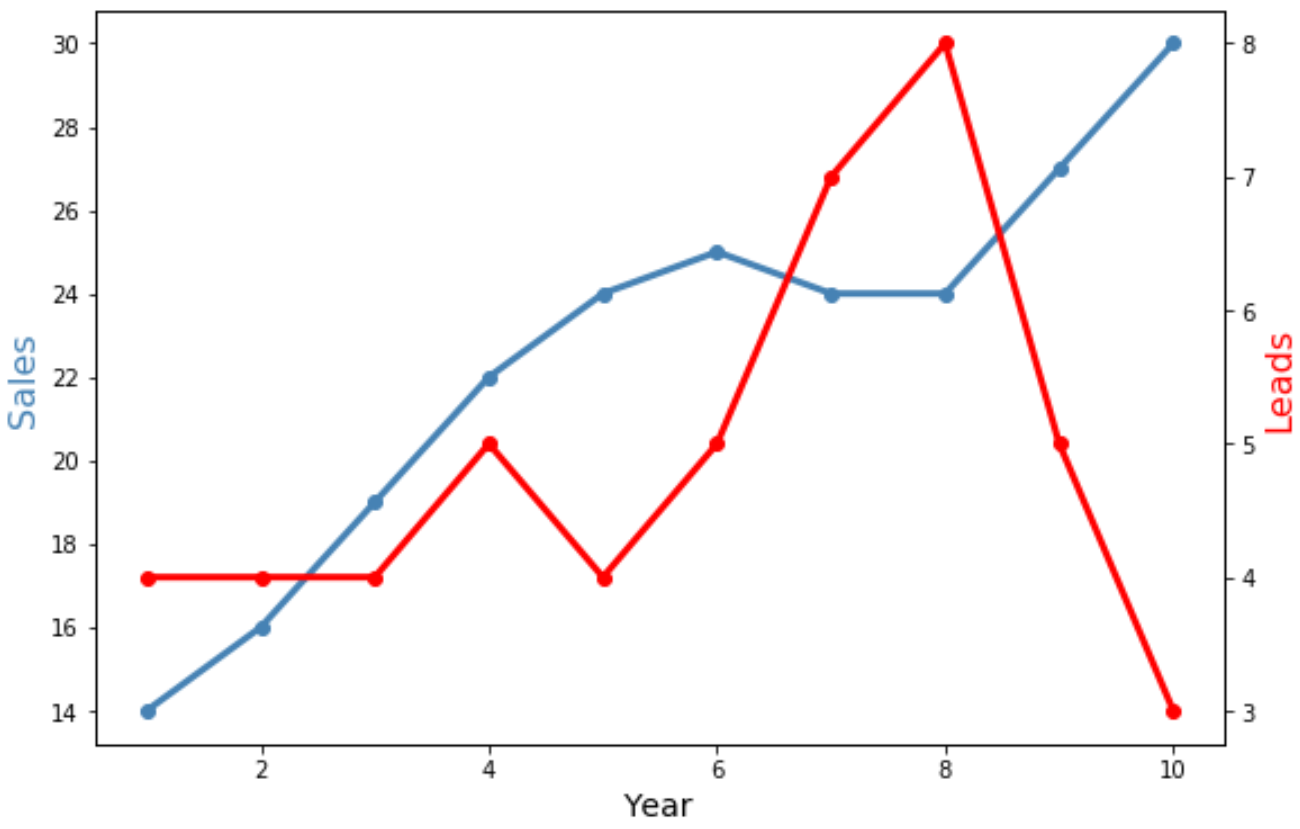
请随意使用标记和线宽参数来更改图表中线条的外观:
 import matplotlib. pyplot as plt

#define colors to use
col1 = ' steelblue '
col2 = ' red '

#define subplots
fig,ax = plt. subplots ()

#add first line to plot
ax. plot (df1. year , df1. sales , color=col1, marker=' o ', linewidth= 3 )

#add x-axis label
ax. set_xlabel (' Year ', fontsize= 14 )

#add y-axis label
ax. set_ylabel (' Sales ', color=col1, fontsize= 16 )

#define second y-axis that shares x-axis with current plot
ax2 = ax. twinx ()

#add second line to plot
ax2. plot (df2. year , df2. leads , color=col2, marker=' o ', linewidth= 3 )

#add second y-axis label
ax2. set_ylabel (' Leads ', color=col2, fontsize= 16 )

请注意,两条线现在都更宽并包含“o”标记来显示各个数据点。
其他资源
以下教程解释了如何在 Matplotlib 中执行其他常见操作:
如何在 Matplotlib 中调整轴标签位置
如何在 Matplotlib 中设置轴范围
如何在Matplotlib中设置X轴值