如何更改 matplotlib 中图例的位置
要更改 Matplotlib 中图例的位置,可以使用plt.legend()函数。
例如,您可以使用以下语法将图例放置在绘图的左上角:
plt. legend (loc=' upper left ')
默认位置是“最佳”——这是 Matplotlib 根据避免覆盖数据点的位置自动找到图例位置的位置。
但是,您可以指定以下标题位置之一:
- 右上
- 在左上角
- 在左下角
- 在右下角
- 正确的
- 中左
- 中右
- 底部中心
- 顶部中心
- 中心
您还可以使用bbox_to_anchor()参数将图例放置在绘图之外。例如,您可以使用以下语法将图例放置在绘图之外的右上角:
plt. legend (bbox_to_anchor=( 1.05 , 1 ), loc=' upper left ', borderaxespad= 0 )
以下示例展示了如何在实践中使用每种方法。
示例 1:更改 Matplotlib 图中图例的位置
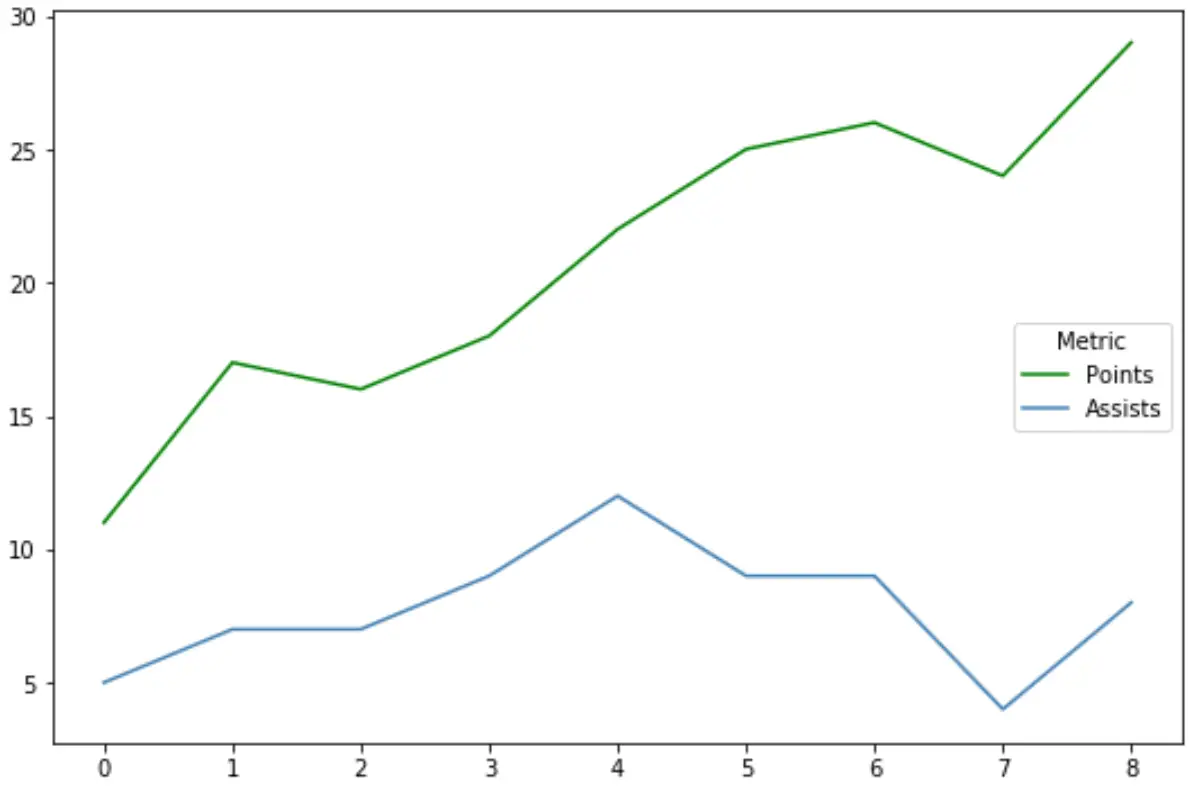
以下代码显示如何将图例放置在 Matplotlib 线图的右中心部分:
 import pandas as pd
import matplotlib. pyplot as plt

#createdata
df = pd. DataFrame ({' points ': [11, 17, 16, 18, 22, 25, 26, 24, 29],
                   ' assists ': [5, 7, 7, 9, 12, 9, 9, 4, 8]})

#add lines to plot
plt. plot (df[' points '], label=' Points ', color=' green ')
plt. plot (df[' assists '], label=' Assists ', color=' steelblue ')

#place legend in center right of plot
plt. legend (loc=' center right ', title=' Metric ')

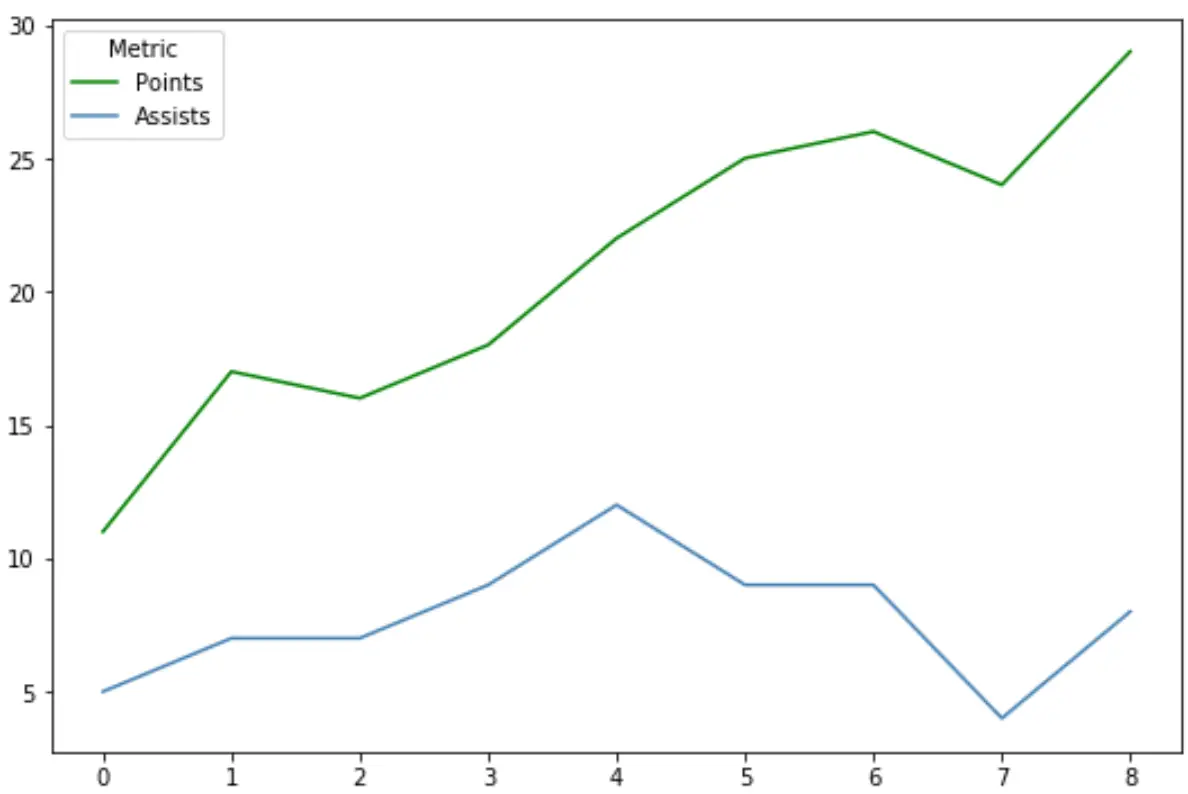
以下代码显示了如何将图例放置在 Matplotlib 图的左上角:
 import pandas as pd
import matplotlib. pyplot as plt

#create data
df = pd. DataFrame ({' points ': [11, 17, 16, 18, 22, 25, 26, 24, 29],
                   ' assists ': [5, 7, 7, 9, 12, 9, 9, 4, 8]})

#add lines to plot
plt. plot (df[' points '], label=' Points ', color=' green ')
plt. plot (df[' assists '], label=' Assists ', color=' steelblue ')

#place legend in center right of plot
plt. legend (loc=' upper left ', title=' Metric ')

示例 2:更改 Matplotlib 绘图外部图例的位置
要将图例放置在 Matplotlib 图之外,我们可以使用bbox_to_anchor()参数。
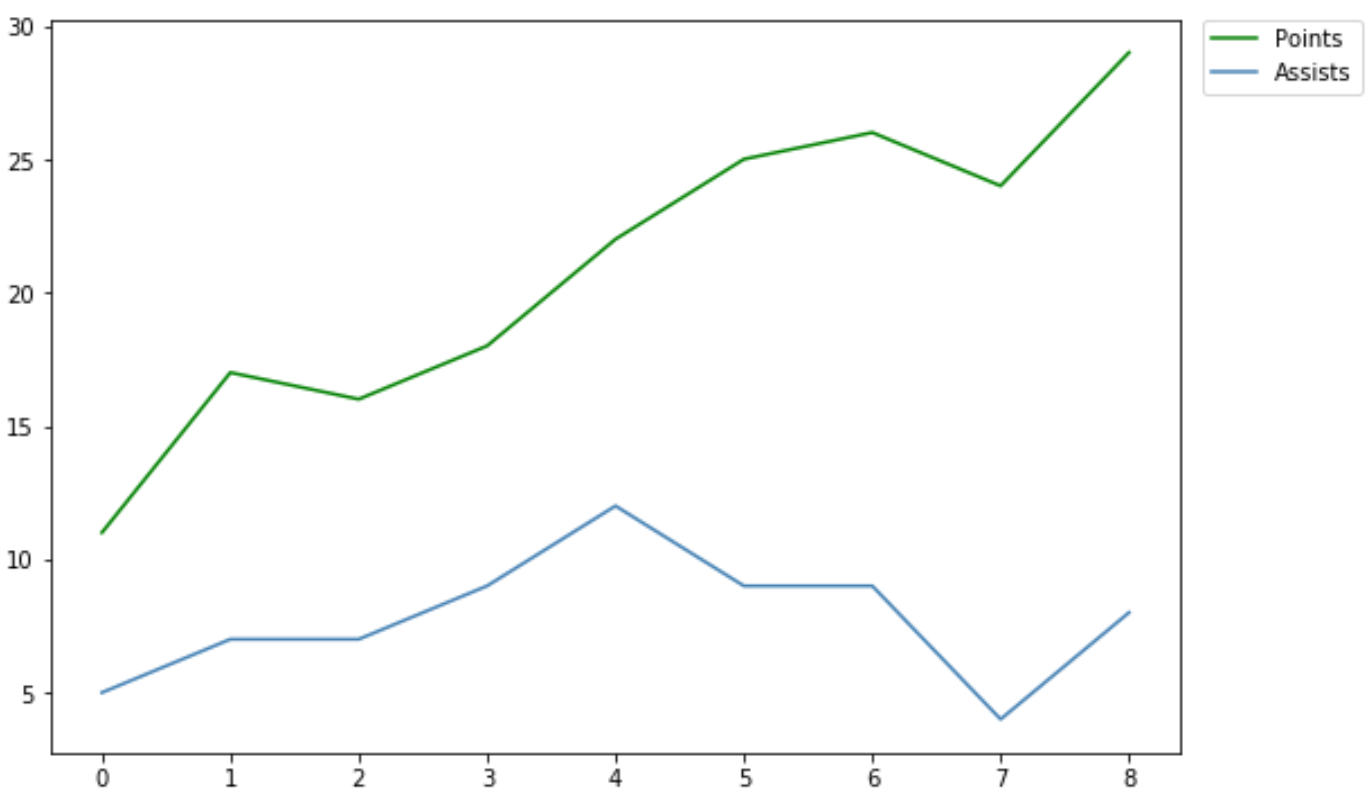
例如,以下是将图例放置在绘图右上角之外的方法:
 import pandas as pd
import matplotlib. pyplot as plt

#create data
df = pd. DataFrame ({' points ': [11, 17, 16, 18, 22, 25, 26, 24, 29],
                   ' assists ': [5, 7, 7, 9, 12, 9, 9, 4, 8]})

#add lines to plot
plt. plot (df[' points '], label=' Points ', color=' green ')
plt. plot (df[' assists '], label=' Assists ', color=' steelblue ')

#place legend in center right of plot
plt. legend (bbox_to_anchor=( 1.02 , 1 ), loc=' upper left ', borderaxespad= 0 )

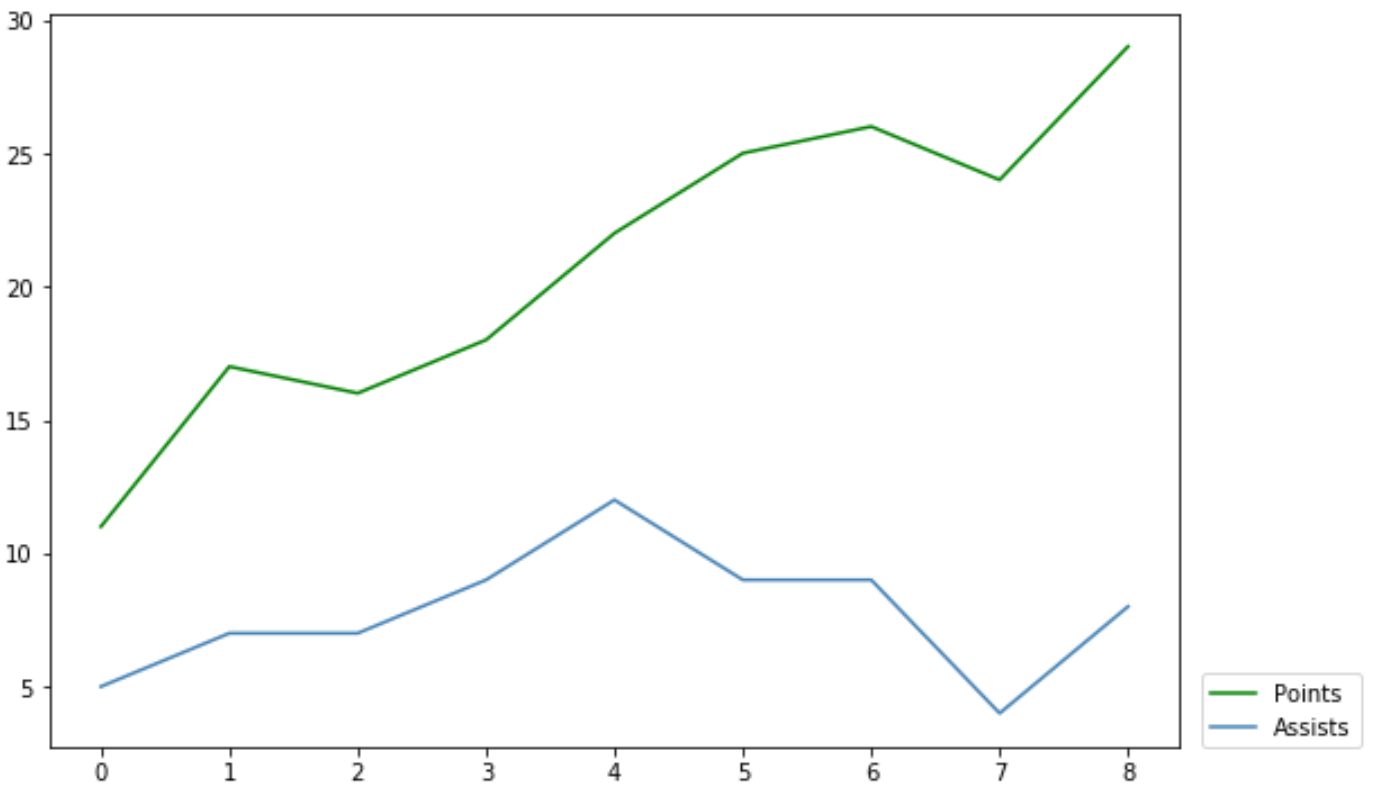
以下是将图例放置在绘图右下角之外的方法:
 import pandas as pd
import matplotlib. pyplot as plt

#create data
df = pd. DataFrame ({' points ': [11, 17, 16, 18, 22, 25, 26, 24, 29],
                   ' assists ': [5, 7, 7, 9, 12, 9, 9, 4, 8]})

#add lines to plot
plt. plot (df[' points '], label=' Points ', color=' green ')
plt. plot (df[' assists '], label=' Assists ', color=' steelblue ')

#place legend in center right of plot
plt. legend (bbox_to_anchor=( 1.02 , 0.1 ), loc=' upper left ', borderaxespad= 0 )

有关bbox_to_anchor()参数的详细说明,请参阅matplotlib 文档。
其他资源
以下教程解释了如何在 Matplotlib 中执行其他常见操作:
如何更改 Matplotlib 中的图例字体大小
如何在 Matplotlib 中为图例添加标题
如何在 Matplotlib 中调整标题位置
如何在 Matplotlib 中调整轴标签位置