如何在 matplotlib 绘图上显示网格线
默认情况下,Matplotlib 不在绘图上显示网格线。但是,您可以使用matplotlib.pyplot.grid()函数轻松显示和自定义绘图上的网格线。
本教程展示了此功能的实际使用示例。
Matplotlib 中的基本散点图
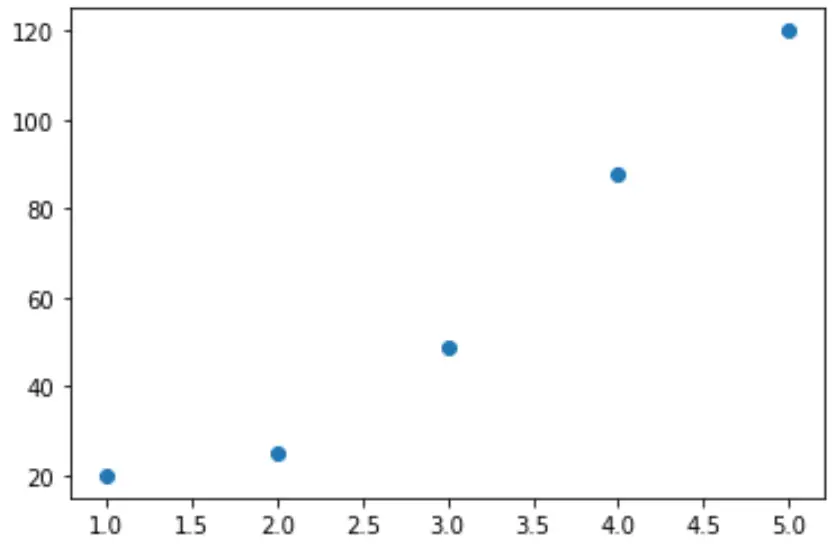
以下代码展示了如何使用 Matplotlib 创建简单的散点图:
 import matplotlib.pyplot as plt

#createdata
x = [1, 2, 3, 4, 5]
y = [20, 25, 49, 88, 120]

#create scatterplot of data
plt. scatter (x,y)
plt. show ()
向两个轴添加网格线
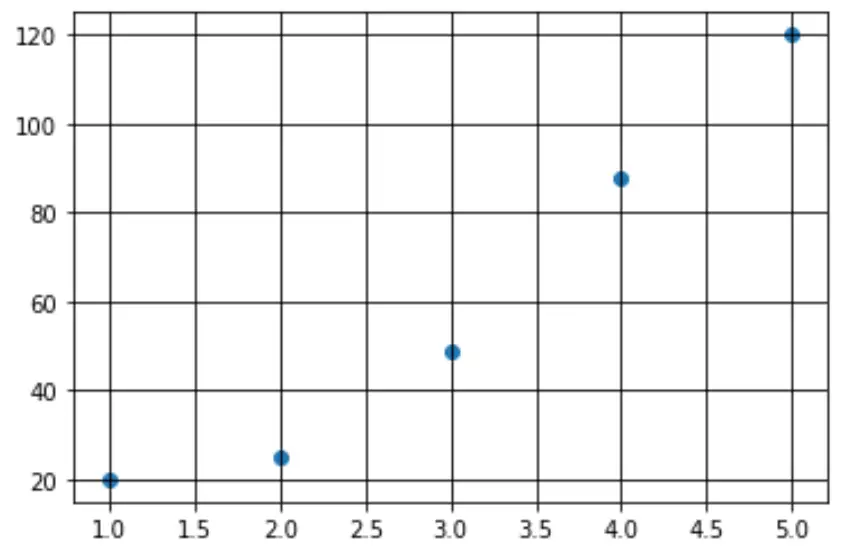
要将网格添加到绘图中,我们可以简单地使用plt.grid(True)命令:
 import matplotlib.pyplot as plt

#create data
x = [1, 2, 3, 4, 5]
y = [20, 25, 49, 88, 120]

#create scatterplot of data with gridlines
plt. scatter (x,y)
plt. grid ( True )
plt. show ()
添加单轴网格
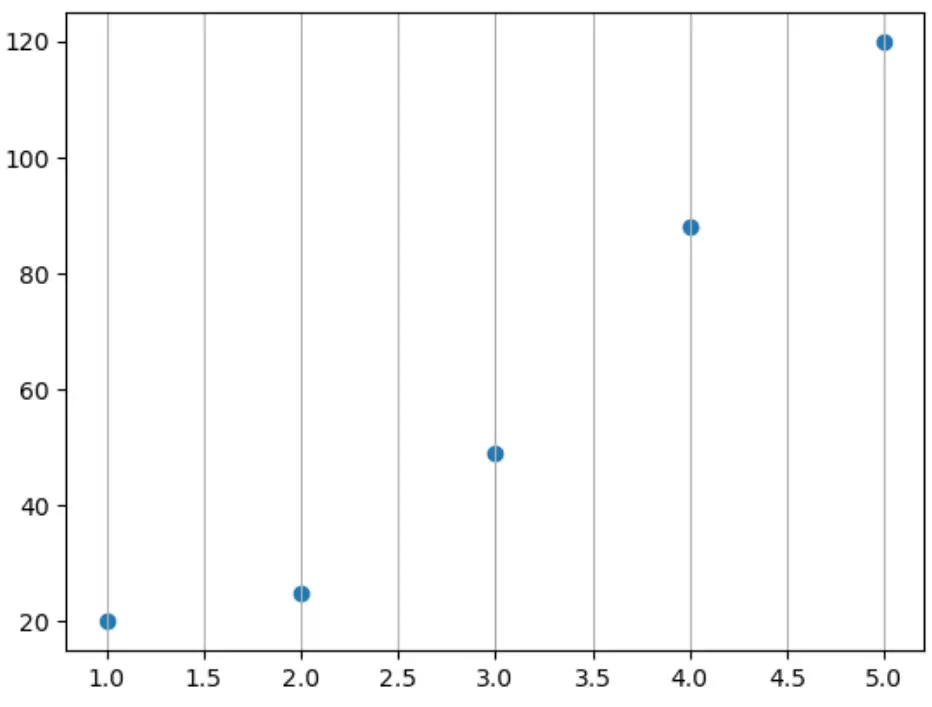
我们可以使用axis参数向 x 轴添加网格线:
 import matplotlib.pyplot as plt

#createdata
x = [1, 2, 3, 4, 5]
y = [20, 25, 49, 88, 120]

#create scatterplot of data with gridlines
plt. scatter (x,y)
plt. grid ( axis=' x ' )
plt. show ()
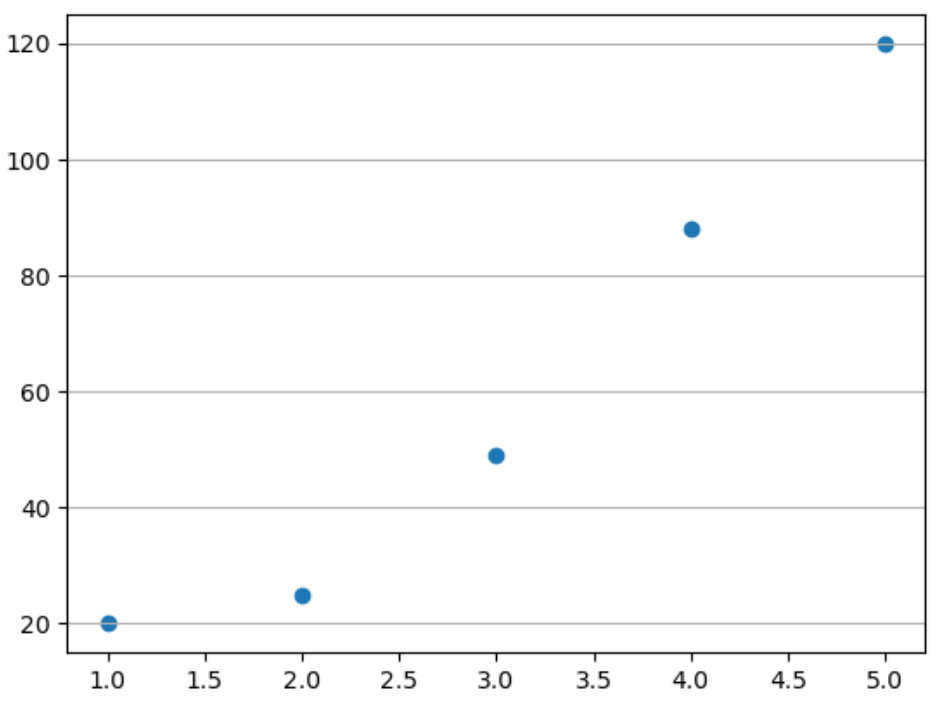
或者只是 y 轴:
 import matplotlib.pyplot as plt

#createdata
x = [1, 2, 3, 4, 5]
y = [20, 25, 49, 88, 120]

#create scatterplot of data with gridlines
plt. scatter (x,y)
plt. grid ( axis=' y ' )
plt. show ()
自定义网格
我们还可以使用plt.rc()函数自定义网格的外观:
 import matplotlib.pyplot as plt

#create data
x = [1, 2, 3, 4, 5]
y = [20, 25, 49, 88, 120]

#create scatterplot of data with gridlines
plt. rc (' grid ', linestyle=' : ', color=' red ', linewidth= 2 )
plt. scatter (x,y)
plt. grid ( True )
plt. show ()
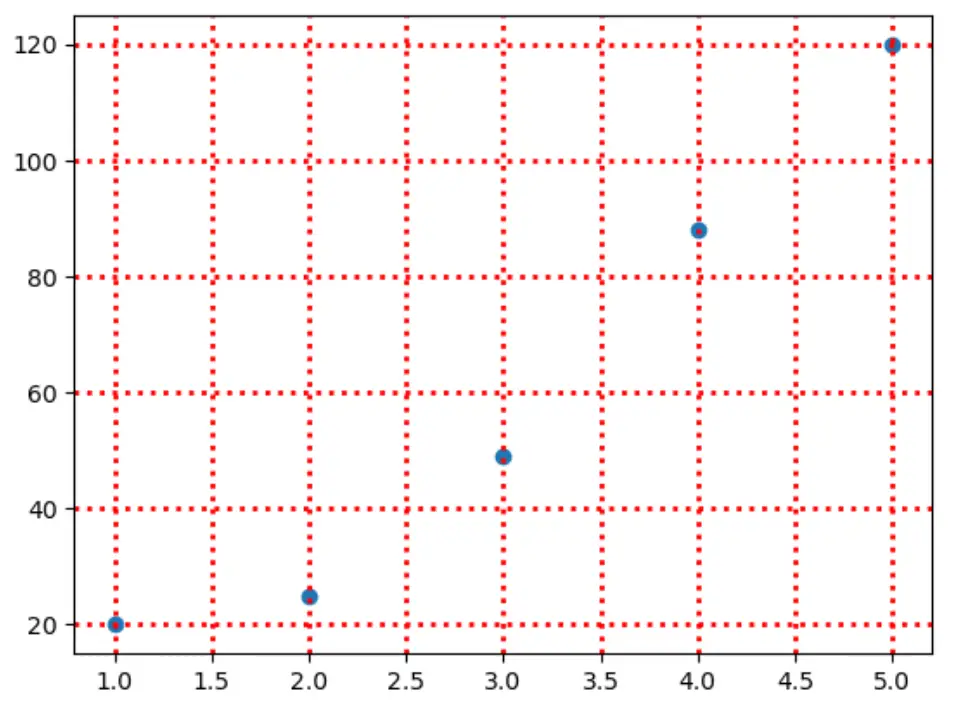
您可以在Matplotlib 文档中找到自定义网格线方法的完整列表。
其他资源
以下教程解释了如何在 Matplotlib 中执行其他常见任务: