如何在 matplotlib 中获取轴限制(举例)
您可以使用以下语法来获取 Matplotlib 中绘图的 x 轴和 y 轴的轴限制:
 import matplotlib. pyplot as plt

#get x-axis and y-axis limits
xmin, xmax, ymin, ymax = plt. axis ()

#print axis limits
print (xmin, xmax, ymin, ymax)
以下示例展示了如何在实践中使用此语法。
示例:如何在 Matplotlib 中获取轴限制
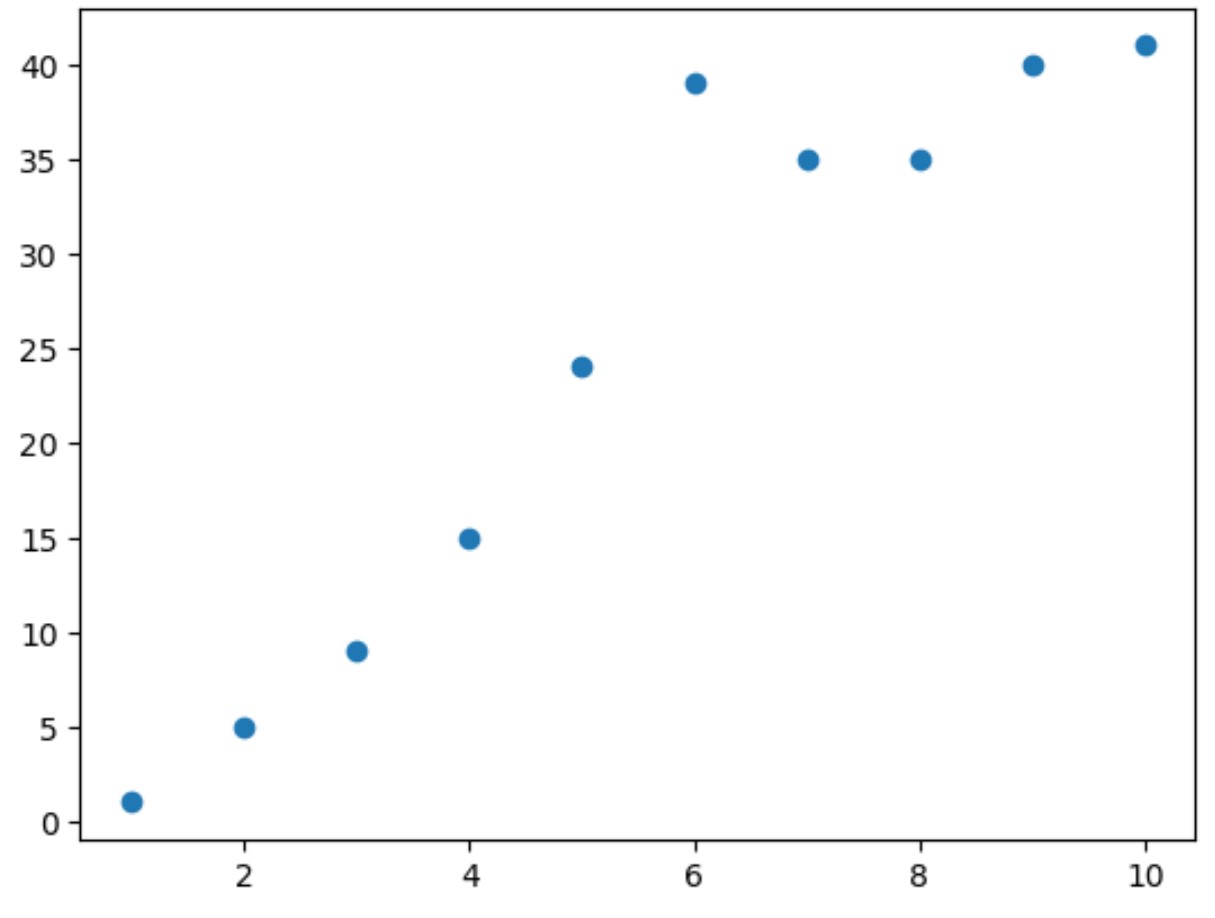
假设我们在 Matplotlib 中创建以下散点图:
 import matplotlib. pyplot as plt

#define x and y
x = [1, 2, 3, 4, 5, 6, 7, 8, 9, 10]
y = [1, 5, 9, 15, 24, 39, 35, 35, 40, 41]

#create scatter plot of x vs. y
plt. scatter (x,y)

我们可以使用以下语法来获取散点图的 x 轴和 y 轴的轴限制:
 import matplotlib. pyplot as plt

#define x and y
x = [1, 2, 3, 4, 5, 6, 7, 8, 9, 10]
y = [1, 5, 9, 15, 24, 39, 35, 35, 40, 41]

#create scatter plot of x vs. y
plt. scatter (x,y)

#get x-axis and y-axis limits
xmin, xmax, ymin, ymax = plt. axis ()

#print axis limits
print (xmin, xmax, ymin, ymax)

0.55 10.45 -1.0 43.0
从结果我们可以看出:
- x 轴最小值: 0.55
- x 轴最大值: 10.45
- y 轴最小值: -1.0
- y 轴最大值: 43.0
这些值对应于上面散点图中可见的轴限制。
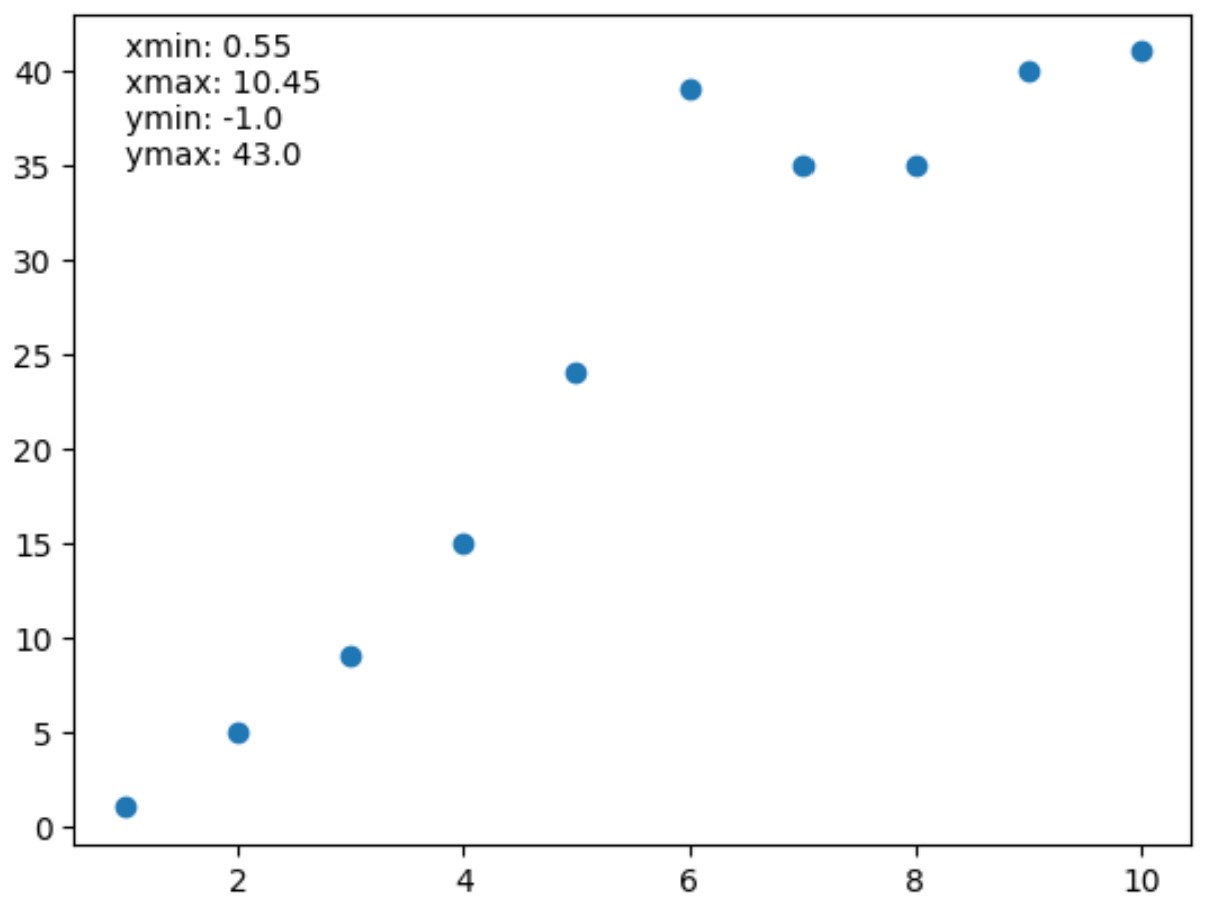
如果需要,我们还可以使用annotate()函数将这些轴限制作为文本值添加到图中:
 import matplotlib. pyplot as plt

#define x and y
x = [1, 2, 3, 4, 5, 6, 7, 8, 9, 10]
y = [1, 5, 9, 15, 24, 39, 35, 35, 40, 41]

#create scatter plot of x vs. y
plt. scatter (x,y)

#get x-axis and y-axis limits
xmin, xmax, ymin, ymax = plt. axis ()

#print axis limits
lims = ' xmin: ' + str(round(xmin, 2 )) + ' \n ' + \
       ' xmax: ' + str(round(xmax, 2 )) + ' \n ' + \
       ' ymin: ' + str(round(ymin, 2 )) + ' \n ' + \
       ' ymax: ' + str(round(ymax, 2 ))

#add axis limits to plot at (x,y) coordinate (1.35)
plt. annotate (lims, ( 1 , 35 ))

其他资源
以下教程解释了如何在 Matplotlib 中执行其他常见任务:
如何在 Matplotlib 中设置轴刻度
如何增加 Matplotlib 中的绘图大小
如何向 Matplotlib 绘图添加文本