如何更改pandas直方图中x轴的范围
您可以使用range参数来更改 pandas 直方图中 x 轴的范围:
plt. hist (df[' var1 '], range=[ 10 , 30 ])
在此特定示例中,我们将 x 轴设置在 10 到 30 之间。
以下示例展示了如何在实践中使用范围参数。
示例:更改 Pandas 直方图中 X 轴的范围
假设我们有以下 pandas DataFrame:
 import pandas as pd
import numpy as np

#make this example reproducible
n.p. random . seeds (1)

#createDataFrame
df = pd. DataFrame ({' team ': np.repeat ([' A ',' B ',' C '], 100 ),
                   ' points ': np. random . normal (loc= 20 , scale= 2 , size= 300 )})

#view head of DataFrame
print ( df.head ())

  team points
0 A 23.248691
1 A 18.776487
2 A 18.943656
3 A 17.854063
4 A 21.730815
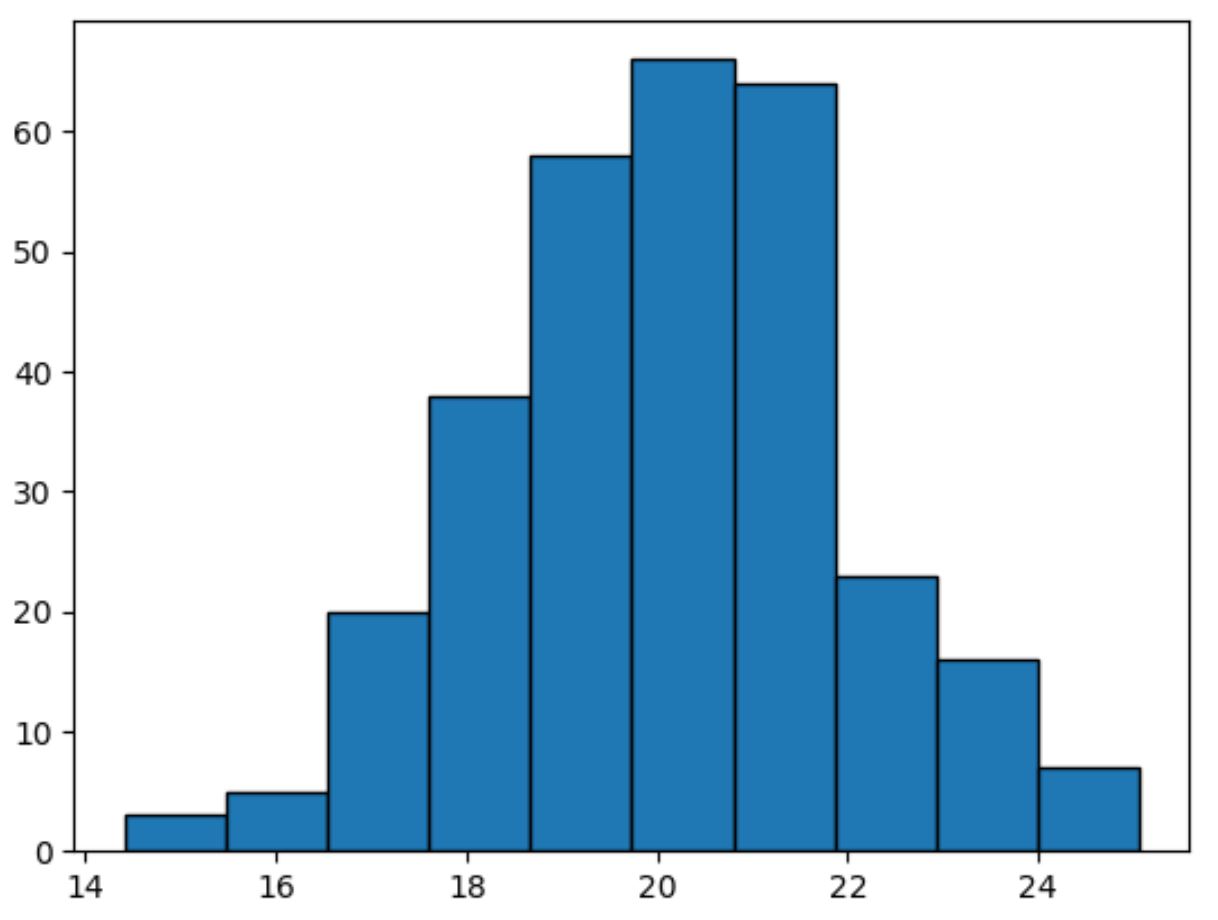
如果我们为points变量创建一个直方图,pandas会根据points变量的最小值和最大值自动选择x轴范围:
 import matplotlib.pyplot as plt

#create histogram for variable points
plt. hist (df[' points '], edgecolor=' black ')

x 轴从 14 到 25。
我们可以使用describe()函数来显示points变量的最小值和最大值:
 #summarize distribution of points variable
df[' points ']. describe ()

count 300.000000
mean 20.148800
std 1.890841
min 14.413830
25% 18.818254
50% 20.176352
75% 21.372843
max 25.056651
Name: points, dtype: float64
我们可以看到最小值为 14.41,最大值为 25.06,这解释了为什么图表中的 x 轴当前范围为 14 到 25。
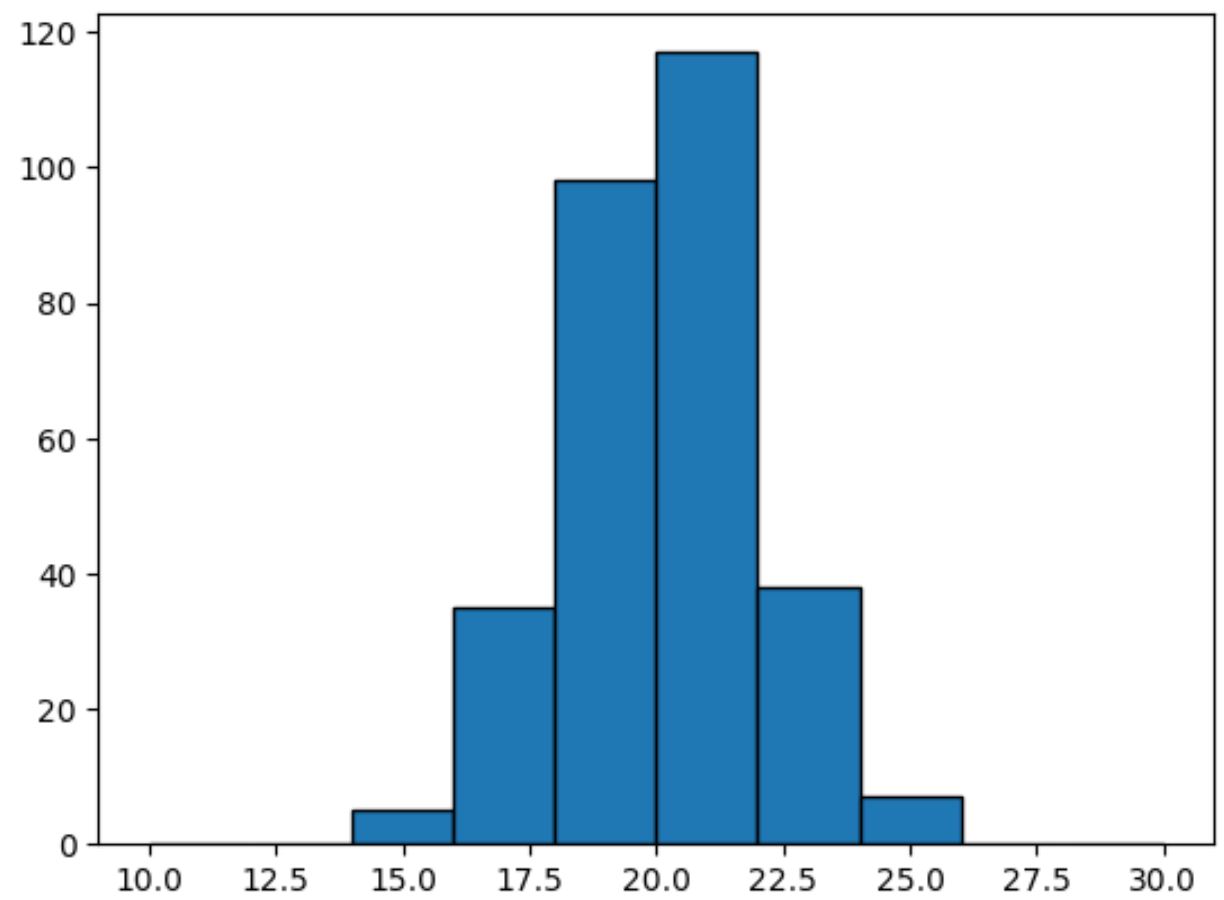
但是,我们可以使用range参数强制 x 轴从 10 到 30:
 import matplotlib.pyplot as plt

#create histogram for points variable with custom x-axis range
plt. hist (df[' points '], edgecolor=' black ', range=[ 10 , 30 ])

请注意,X 轴现在的范围是从 10 到 30。
其他资源
以下教程解释了如何执行其他常见的 panda 任务:
如何从 Pandas DataFrame 创建直方图
如何从 Pandas 系列创建直方图
如何在 Pandas 中按组绘制直方图