如何在python中执行多维缩放
在统计学中,多维尺度是一种在抽象笛卡尔空间(通常是二维空间)中可视化数据集中观察结果相似性的方法。
在 Python 中执行多维缩放的最简单方法是使用sklearn.manifold子模块的MDS()函数。
下面的例子展示了如何在实际中使用这个功能。
示例:Python 中的多维缩放
假设我们有以下 pandas DataFrame,其中包含有关各种篮球运动员的信息:
 import pandas as pd

#create DataFrane
df = pd. DataFrame ({' player ': ['A', 'B', 'C', 'D', 'E', 'F', 'G', 'H', 'I', 'J', 'K '],
                   ' points ': [4, 4, 6, 7, 8, 14, 16, 19, 25, 25, 28],
                   ' assists ': [3, 2, 2, 5, 4, 8, 7, 6, 8, 10, 11],
                   ' blocks ': [7, 3, 6, 7, 5, 8, 8, 4, 2, 2, 1],
                   ' rebounds ': [4, 5, 5, 6, 5, 8, 10, 4, 3, 2, 2]})

#set player column as index column
df = df. set_index (' player ')

#view Dataframe
print (df)

        points assists blocks rebounds
player
A 4 3 7 4
B 4 2 3 5
C 6 2 6 5
D 7 5 7 6
E 8 4 5 5
F 14 8 8 8
G 16 7 8 10
H 19 6 4 4
I 25 8 2 3
D 25 10 2 2
K 28 11 1 2
我们可以使用以下代码通过sklearn.manifold模块的MDS()函数执行多维缩放:
 from sklearn. manifold import MDS

#perform multi-dimensional scaling
mds = MDS(random_state= 0 )
scaled_df = mds. fit_transform (df)

#view results of multi-dimensional scaling
print (scaled_df)

[[ 7.43654469 8.10247222]
 [4.13193821 10.27360901]
 [5.20534681 7.46919526]
 [6.22323046 4.45148627]
 [3.74110999 5.25591459]
 [3.69073384 -2.88017811]
 [3.89092087 -5.19100988]
 [ -3.68593169 -3.0821144 ]
 [ -9.13631889 -6.81016012]
 [ -8.97898385 -8.50414387]
 [-12.51859044 -9.08507097]]
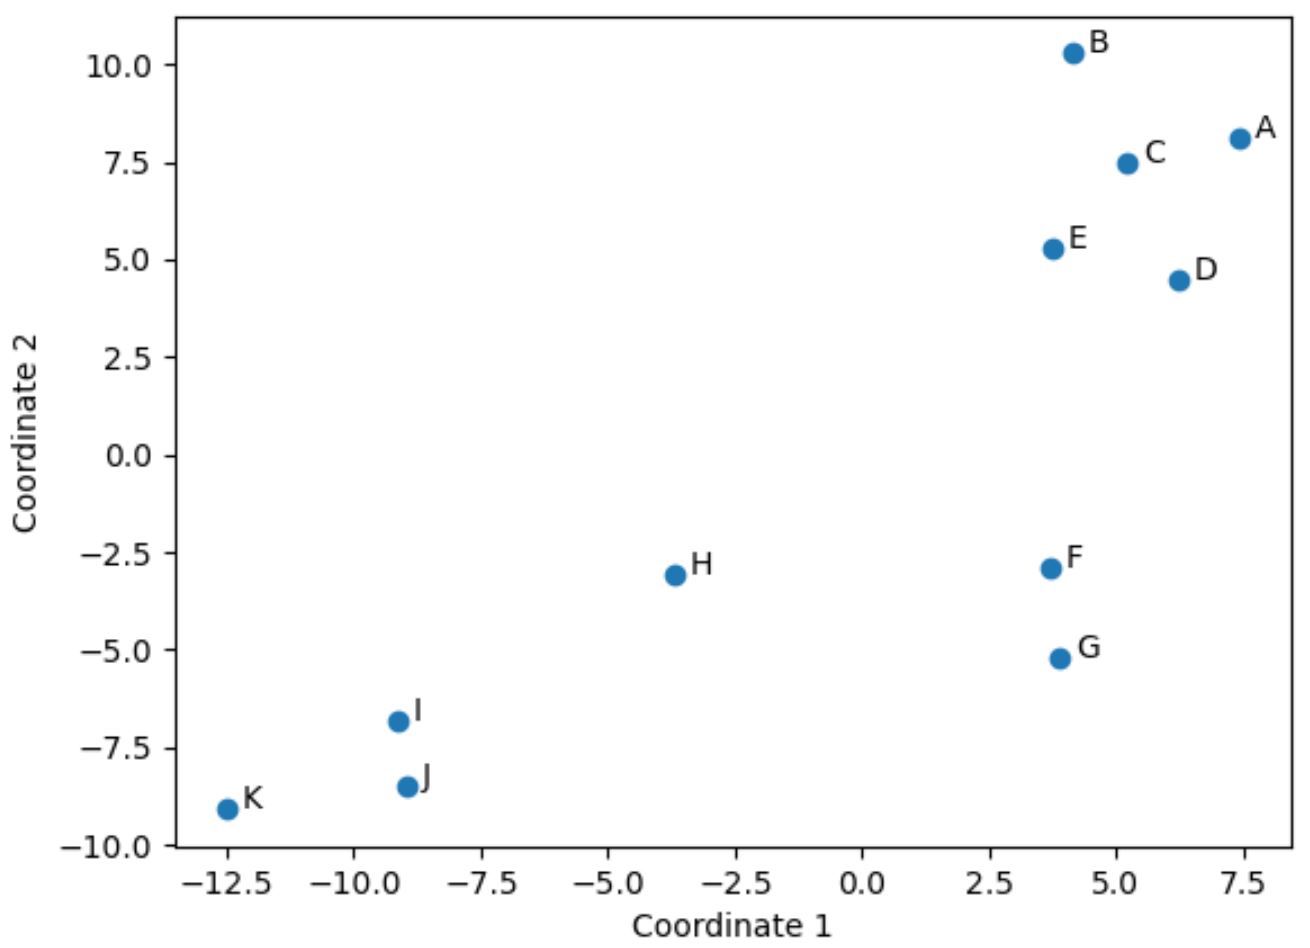
原始 DataFrame 的每一行都已缩减为 (x, y) 坐标。
我们可以使用以下代码在 2D 空间中可视化这些坐标:
 import matplotlib.pyplot as plt

#create scatterplot
plt. scatter (scaled_df[:,0], scaled_df[:,1])

#add axis labels
plt. xlabel (' Coordinate 1 ')
plt. ylabel (' Coordinate 2 ')

#add lables to each point
for i, txt in enumerate( df.index ):
    plt. annotate (txt, (scaled_df[:,0][i]+.3, scaled_df[:,1][i]))

#display scatterplot
plt. show ()

原始 DataFrame 中在原始四列(得分、助攻、盖帽和篮板)中具有相似值的球员在图中彼此接近。
例如,玩家F和G彼此接近。以下是原始 DataFrame 中的它们的值:
 #select rows with index labels 'F' and 'G'
df. loc [[' F ',' G ']]

        points assists blocks rebounds
player
F 14 8 8 8
G 16 7 8 10
他们的得分、助攻、盖帽和篮板数值都非常相似,这解释了为什么他们在 2D 图中彼此如此接近。
相比之下,考虑情节中相距较远的玩家B和K。
如果我们在原始DataFrame中引用它们的值,我们可以看到它们有很大不同:
 #select rows with index labels 'B' and 'K'
df. loc [[' B ',' K ']]

        points assists blocks rebounds
player
B 4 2 3 5
K 28 11 1 2
因此,2D 图是可视化每个玩家在 DataFframe 中所有变量中的相似程度的好方法。
具有相似统计数据的玩家被紧密地分组在一起,而具有非常不同统计数据的玩家在情节中彼此相距较远。
其他资源
以下教程解释了如何在 Python 中执行其他常见任务: