如何在 python 中创建帕累托图(分步)
帕累托图是一种显示类别的有序频率以及类别的累积频率的图表。

本教程提供了使用 Python 创建 Pareto 图的分步示例。
第 1 步:创建数据
假设我们进行一项调查,要求 350 名不同的人在品牌 A、B、C、D 和 E 之间找出他们最喜欢的谷物品牌。
我们可以创建以下 pandas DataFrame 来保存调查结果:
 import pandas as pd

#createDataFrame
df = pd. DataFrame ({' count ': [97, 140, 58, 6, 17, 32]})
df. index = ['B', 'A', 'C', 'F', 'E', 'D']

#sort DataFrame by count descending
df = df. sort_values (by=' count ', ascending= False )

#add column to display cumulative percentage
df[' cumperc '] = df[' count ']. cumsum ()/df[' count ']. sum ()*100

#view DataFrame
df

	count cumperc
At 140 40.000000
B 97 67.714286
C 58 84.285714
D 32 93.428571
E 17 98.285714
F 6 100.000000
第 2 步:创建帕累托图
我们可以使用以下代码来创建 Pareto 图:
 import matplotlib. pyplot as plt
from matplotlib. ticker import PercentFormatter

#define aesthetics for plot
color1 = ' steelblue '
color2 = ' red '
line_size = 4

#create basic bar plot
fig, ax = plt. subplots ()
ax. bar (df. index , df[' count '], color=color1)

#add cumulative percentage line to plot
ax2 = ax. twinx ()
ax2. plot ( df.index , df[' cumperc '], color=color2, marker=" D ", ms=line_size)
ax2. yaxis . set_major_formatter (PercentFormatter())

#specify axis colors
ax. tick_params (axis=' y ', colors=color1)
ax2. tick_params (axis=' y ', colors=color2)

#display Pareto chart
plt. show ()

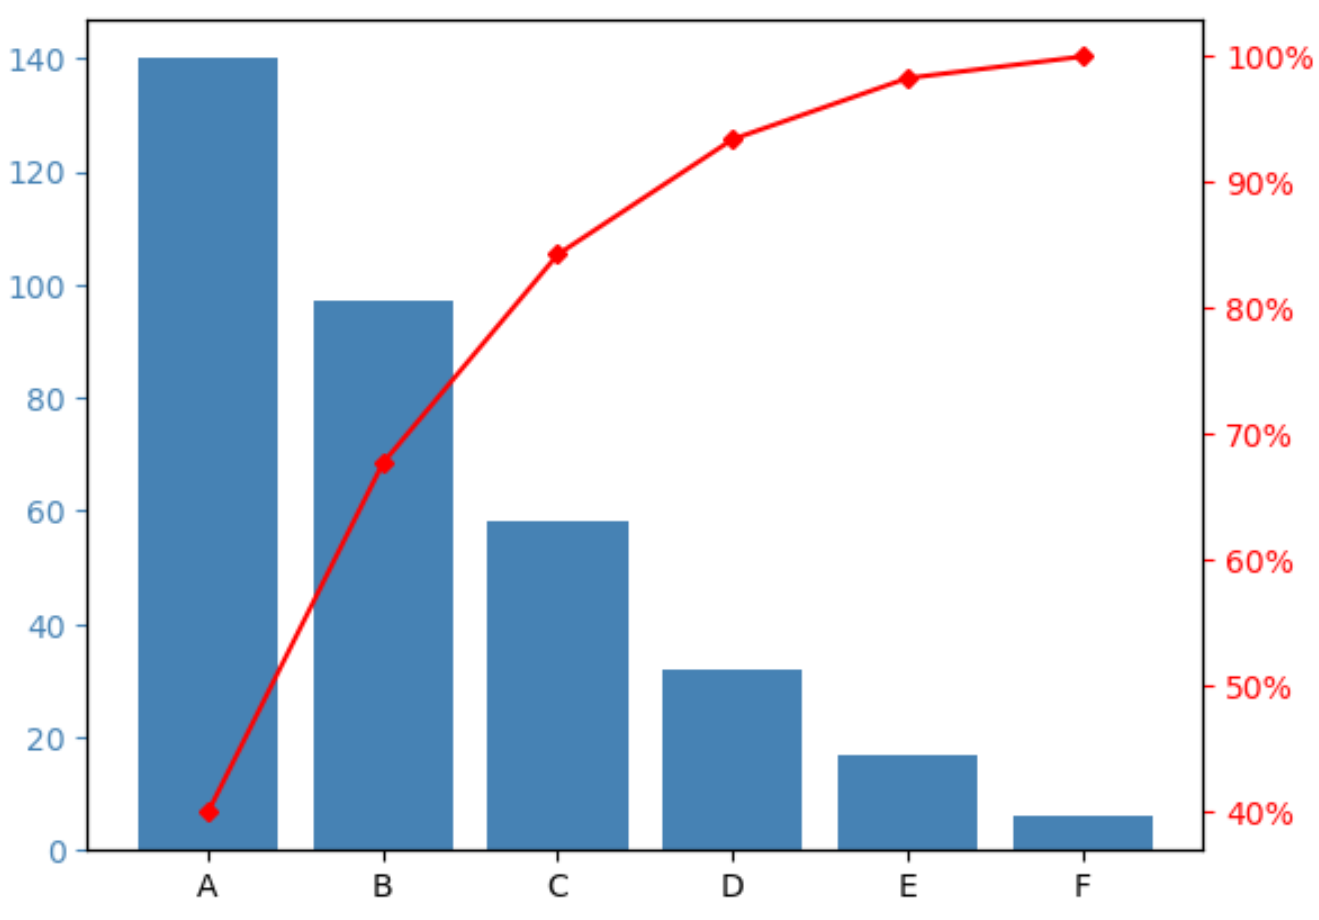
X 轴显示不同品牌的频率从最高到最低的顺序。
左y轴显示每个品牌的频率,右y轴显示品牌的累积频率。
例如,我们可以看到:
- 品牌 A 约占调查回复总数的 40%。
- 品牌 A 和 B 约占调查回复总数的 70%。
- 品牌 A、B 和 C 约占调查回复总数的 85%。
等等。
第 3 步:自定义 Pareto 图(可选)
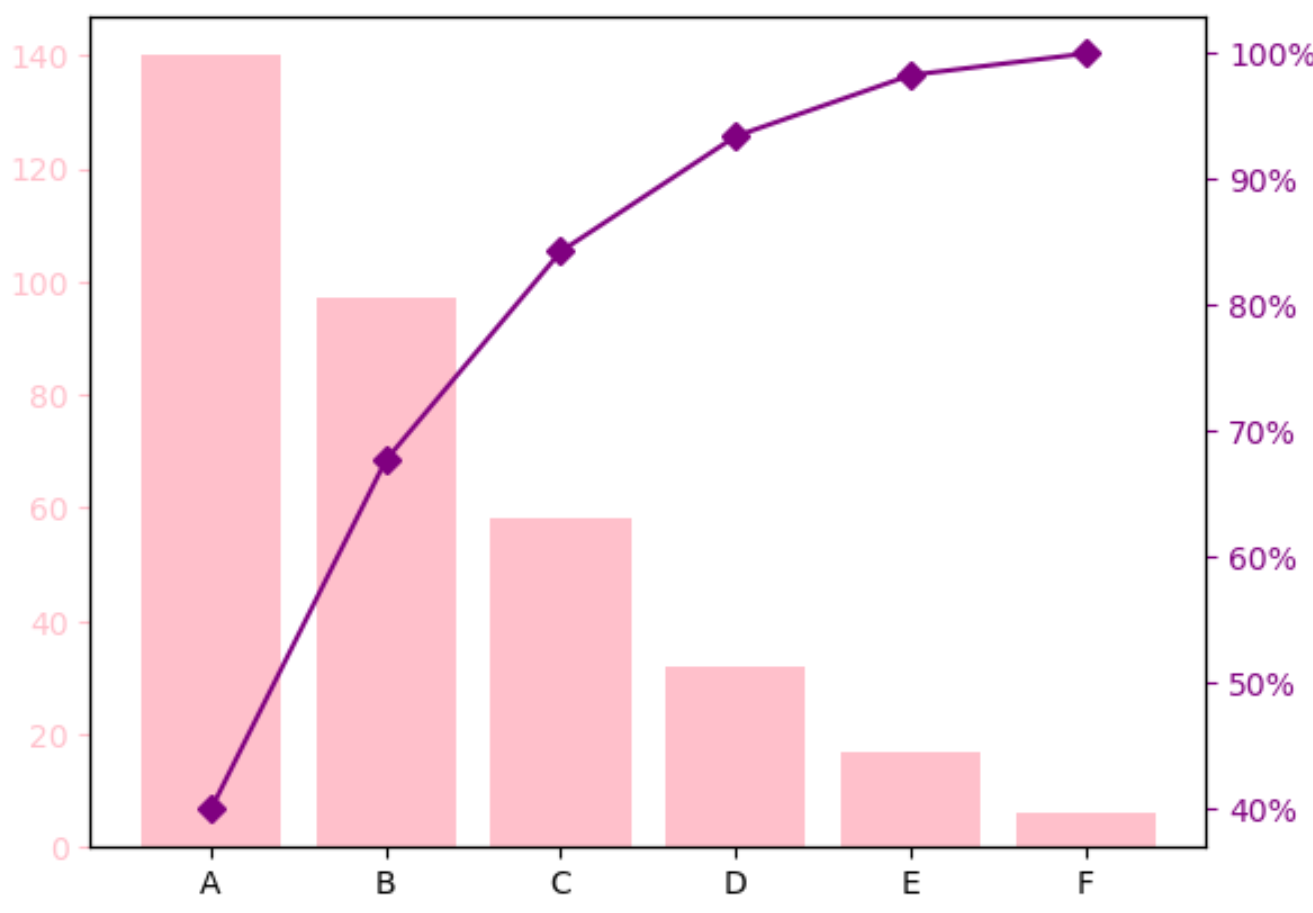
您可以更改条形颜色和累积百分比线的大小,以使帕累托图看起来像您想要的那样。
例如,我们可以将条形更改为粉红色,将线条更改为紫色且稍粗:
 import matplotlib. pyplot as plt
from matplotlib. ticker import PercentFormatter

#define aesthetics for plot
color1 = ' pink '
color2 = ' purple '
line_size = 6

#create basic bar plot
fig, ax = plt. subplots ()
ax. bar (df. index , df[' count '], color=color1)

#add cumulative percentage line to plot
ax2 = ax. twinx ()
ax2. plot (df.index , df[' cumperc '], color=color2, marker=" D ", ms=line_size )
ax2. yaxis . set_major_formatter (PercentFormatter())

#specify axis colors
ax. tick_params (axis=' y ', colors=color1)
ax2. tick_params (axis=' y ', colors=color2)

#display Pareto chart
plt. show ()

其他资源
以下教程介绍了如何在 Python 中创建其他常见可视化效果: